Fig. 3.
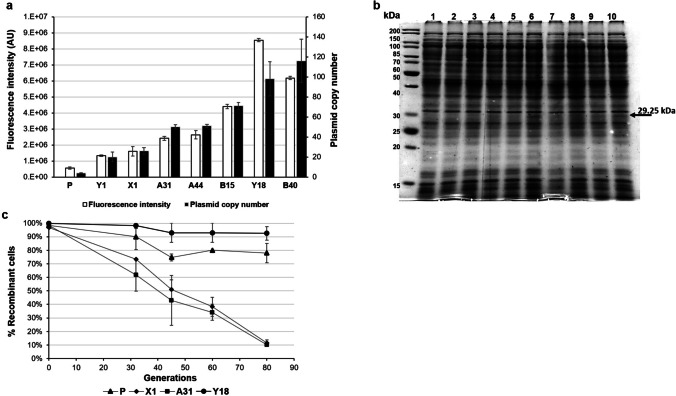
Characterization of the seven selected psychrophilic clones carrying mutant OriR sequences. a Analysis of the R9-GFP expression by spectrofluorimetry (open bars) and determination of plasmid copy number by qPCR (solid bars) of the progenitor (P) and selected clones (X1, Y1, A31, A44, B15, B40, Y18) are plotted on bar graph. The fluorescence of the progenitor and the clones indicated on the x-axis was monitored on induced cells (5 mM IPTG) after 24 h from induction. Fluorescence intensities are reported in arbitrary units (AU) as mean ± SD. b SDS-PAGE analysis of cell extracts of KrPL strains producing R9-GFP after 24 h from induction. lane 1, non-induced progenitor; lane 2, non-induced Y18; lane 3, induced progenitor; lane 4, induced X1; lane 5, induced Y1; lane 6, induced Y18; lane 7, induced A31; lane 8, induced A44; lane 9, induced B15; lane 10, induced B40. Black arrows on the right of the gel represent the expected molecular weights of the recombinant proteins. Black arrows inside the gel highlight the bands of the R9-gfp. c Plasmid stability assay. Plasmids pMAI79-R9-gfp (P, ▲), pX1-R9-gfp (♦), pA31-R9-gfp (■), pY18-R9-gfp (•) were separately propagated in KrPL for 80 generations without antibiotic selection. Plasmid stability was determined by replica plating onto selective media and presented as a percentage of cells that retain antibiotic resistance. Each experiment was carried out as biological duplicates and the error bars represent standard deviations

