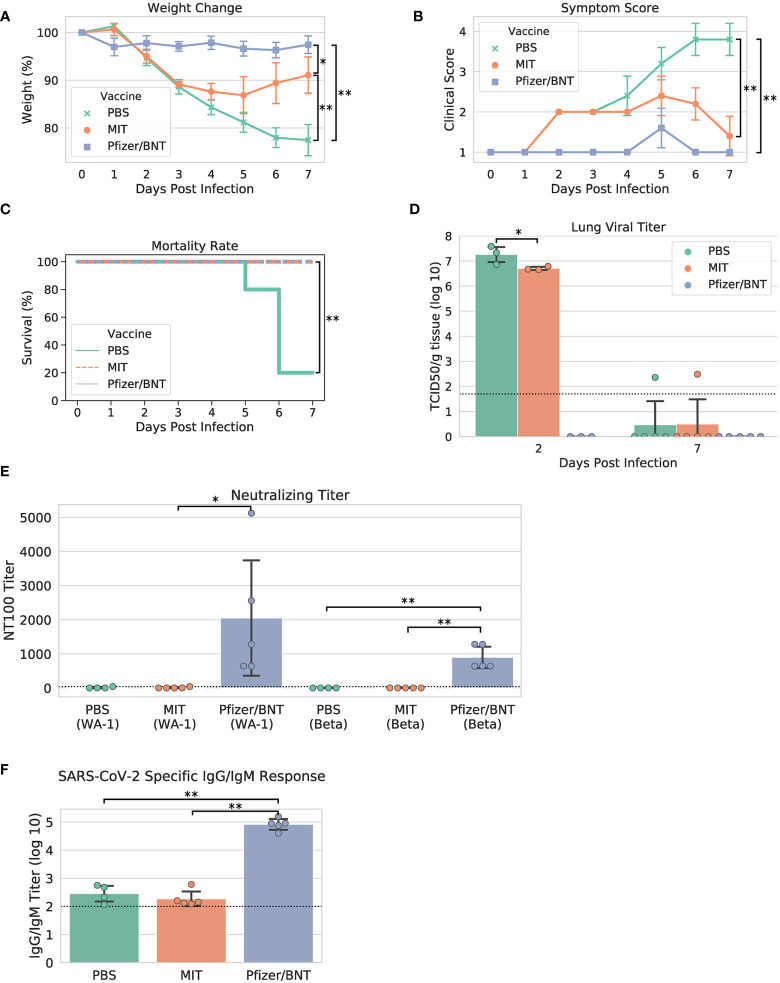
Figure 3.
Study phenotypic data, lung viral titer, and vaccine antibody responses. (A) Weights vs. days post infection, (B) clinical scores vs. days post infection, (C) Kaplan-Meier mortality curve (mortality at 80% weight loss), (D) lung viral titer, (E) maximum serum dilution that provided 100% neutralization of viral infection in vitro, (F) IgG/IgM titer measured by ELISA against cell lysate infected with WA-1 SARS-CoV-2. Dotted lines in (D–F) indicate assay limits of detection. Error bars indicate the standard deviation around each mean. P values were computed by one-way ANOVA with Tukey’s test except (C) P values were computed using the logrank test. *P < 0.05 and **P < 0.01.

