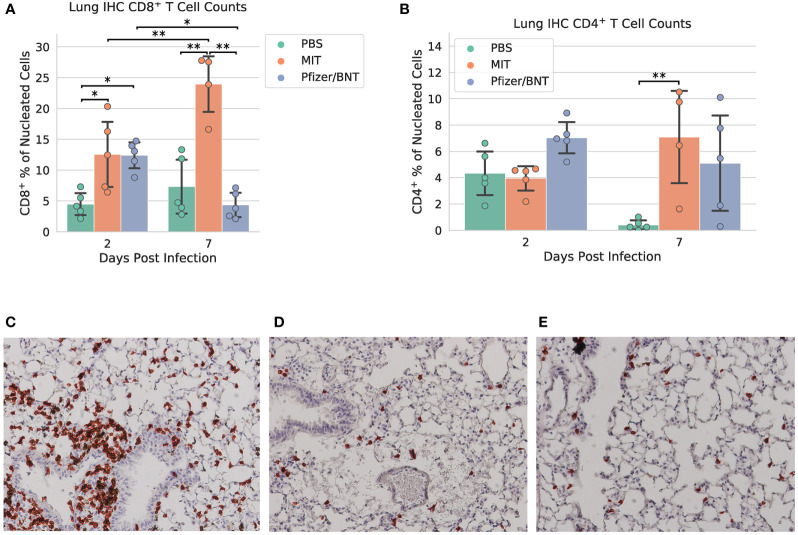
Figure 4.
Lung immunohistochemistry for CD8+ and CD4+ cells. Counts of (A) CD8+ and (B) CD4+ T cells expressed as a percentage of all nucleated cells visible in each field from lung tissue. Example CD8+ stain images at 7 dpi for (C) MIT-T-COVID, (D) Pfizer/BNT, and (E) PBS-immunized animals. Lung samples were subjected to IHC staining for CD8 (brown) with hematoxylin counterstain (blue). Images were taken at 10x magnification. Red outlines in (C-E) indicate CD8+ cells identified and counted by CellProfiler software ( Supplementary Methods ). Error bars indicate the standard deviation around each mean. P values were computed by two-way ANOVA with Tukey’s test. *P < 0.05 and **P < 0.01. See also Supplementary Figures 5–7 .

