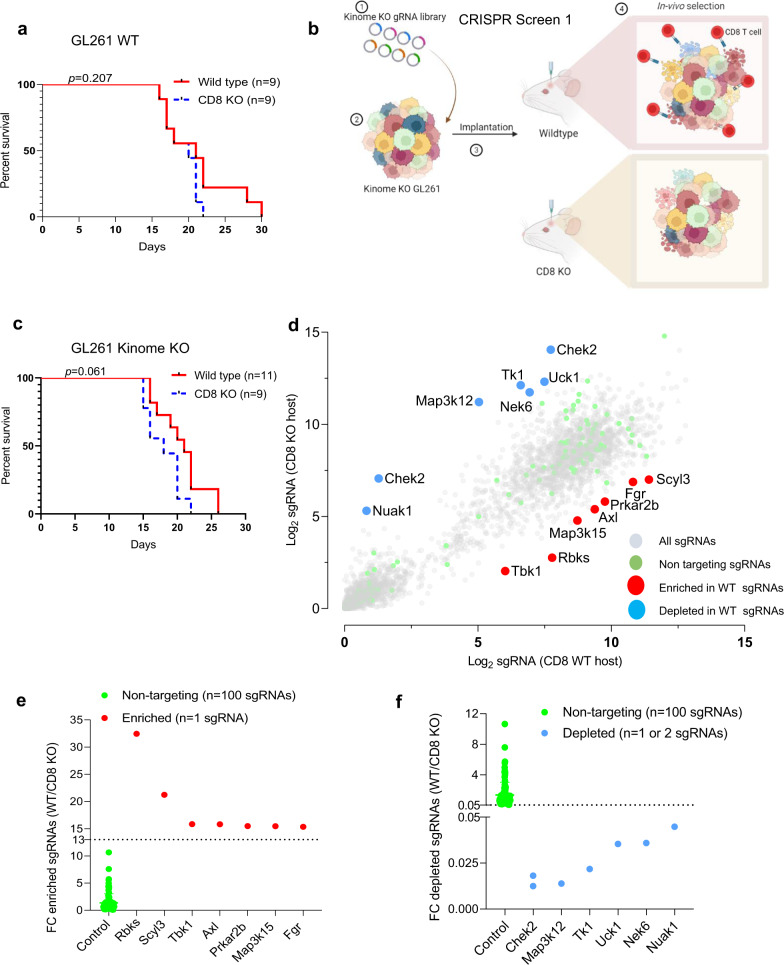
Fig. 1. In vivo kinome knockout CRISPR screen in CD8 KO and WT mice.
a KM survival curves of the C57BL/6 WT and CD8 KO mice (n = 9/group) bearing GL261 glioma. The median survival durations in the groups were: WT, 21 days; CD8 KO, 20 days; Statistics: WT versus CD8 KO, log-rank test p = 0.2. b Schematic representation of the in vivo CRISPR screen. Mouse glioma cells GL261 were transduced with kinome knockout library and the transformed cells were implanted in WT and CD8 KO mice. The library representation of >500X was maintained in the WT and CD8 KO group by injecting 2 × 10⁵ cells/mouse. As the animals approached the endpoint, they were sacrificed, and the genomic DNA was extracted from the tumor region, guides were amplified, and sequenced. c KM analysis of the animals in the CRISPR screen 1. The KM plot shows percent survival of WT (n = 11) and CD8 KO (n = 9) animals bearing kinome KO GL261 glioma cells. The median survival durations in the groups were as follows: WT, 21 days; CD8 KO, 18 days; Statistics: WT versus CD8 KO, log-rank test p = 0.06. d Scatter plot showing the top kinases with the most enriched or depleted sgRNAs in the WT as compared to the CD8 KO animals. The sky blue dots correspond to the top depleted sgRNAs, while the red dots represent the most enriched sgRNAs in the WT as compared to the CD8 KO animals. The gray dots are all other sgRNAs. e The Y-axis shows fold change (fc) WT over CD8 KO of the normalized sgRNA counts. The red dots correspond to the top enriched sgRNAs and the fluorescent dots are all non-targeting sgRNAs. f The Y-axis shows fc WT over CD8 KO of the normalized sgRNA counts. The blue dots correspond to the top depleted sgRNAs and the fluorescent dots are all non-targeting sgRNAs. For e, f the error bars on non-targeting sgRNAs represent mean ± SD. Source data for a, c–f are provided as a Source Data file.

