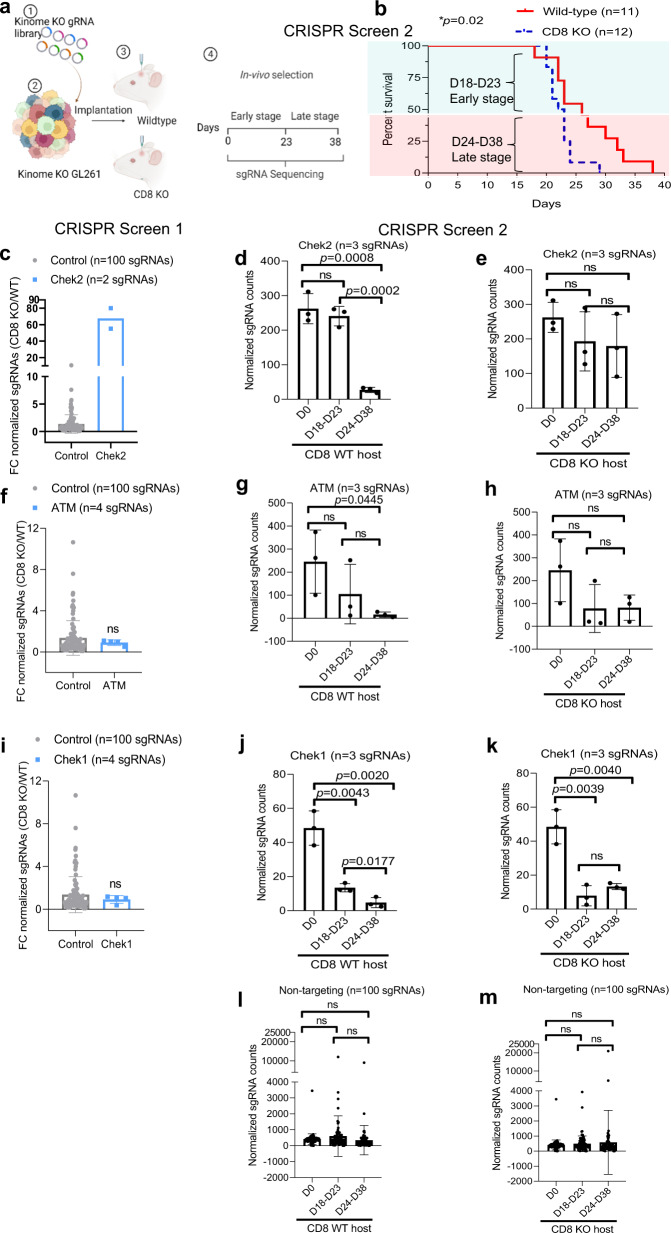
Fig. 2. In vivo kinome knockout CRISPR screen with early and late time points shows selection of Chek2 KO glioma cells over time in intact immunity mice as compared to CD8 KO mice.
a Schematic representation of the second in vivo CRISPR screen. The library representation of 733X was maintained in the WT (n = 11) and 800X in the CD8 KO (n = 12) group by injecting 200,000 cells/mouse. Different barcodes were assigned to the animals that were sacrificed at the early stage (D18-D23) and animals sacrificed at the late stage (D24–D38) from both WT and CD8 KO hosts, guides were amplified and sequenced. b KM analysis of the animals in the second CRISPR screen. The KM plot shows percent survival of wild-type and CD8 KO animals bearing kinome KO glioma cells. p = 0.02 using the log-rank test. c The histogram shows 74-fold enrichment of Chek2 sgRNAs in CD8 KO mice as compared to the WT mice in the CRISPR screen 1. In the CRISPR screen 2, d, e Change in Chek2 KO glioma cells over time in WT and in CD8 KO mice respectively. f The histogram shows change in Atm sgRNAs in CD8 KO mice as compared to the WT mice in the CRISPR screen 1. In the CRISPR screen 2, g, h Change in Atm KO glioma cells over time in WT and in CD8 KO mice respectively. i The histogram shows fold change in Chek1 sgRNAs in CD8 KO mice as compared to the WT mice in the CRISPR screen 1. In the CRISPR screen 2, j, k Depletion of Chek1 KO glioma cells over time in WT and in CD8 KO mice respectively. The distribution of non-targeting sgRNAs over time in WT mice (l) and CD8 KO mice (m) of the CRISPR screen 2. For c–m the error bars represents mean ± SD. For d–m statistics was done using unpaired two-tailed t-test (without adjustments for multiple comparisons). Source data for Fig. b–m are provided as a Source Data file.

