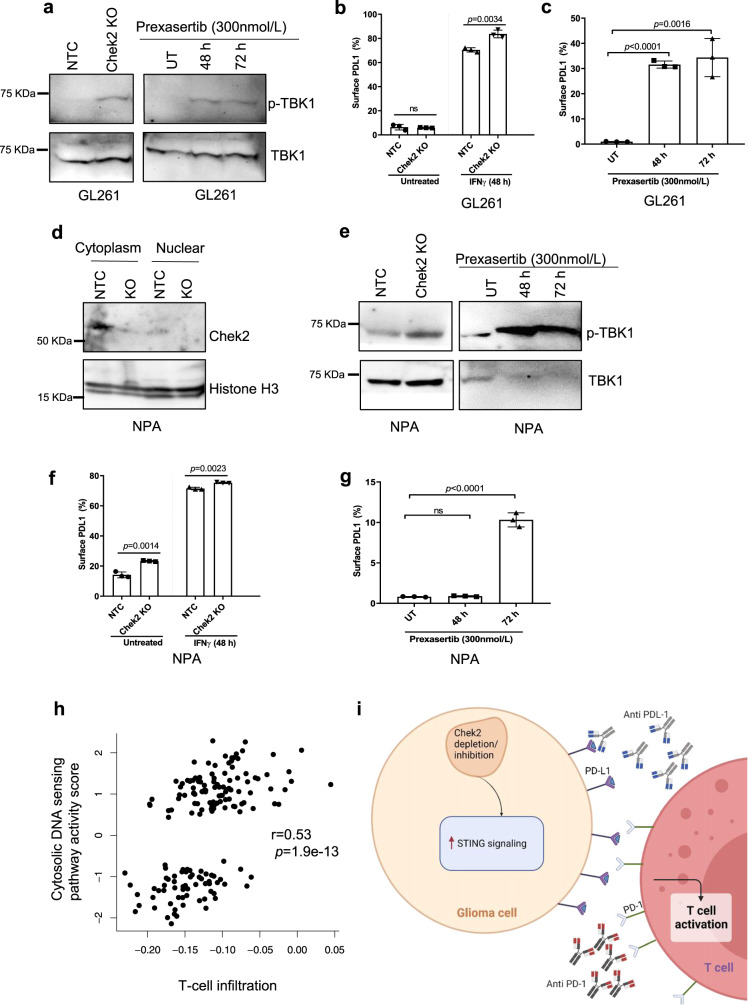
Fig. 5. Chek2 depletion/inhibition leads to STING pathway activation in mouse glioma cells.
a Western blot showing the phosphorylation of TBK1 in GL261 Chek2 KO and non-targeting control (NTC) clones and in GL261 glioma cells treated with Chek1/Chek2 inhibitor Prexasertib (300 nmol/L) at the indicated time points. Total TBK1/β-Actin is used as a loading control. N = 3 independent replicates. Flow cytometry analysis showing surface expression of b, PD-L1 on GL261 Chek2 KO and NTC clones, at the basal level and upon stimulation with IFNγ for 48 h and c, PD-L1 on GL261 glioma cells treated with Prexasertib (300 nmol/L) at the indicated time points. d Western blot showing knockout of Chek2 in NPA cells. Histone H3 is used as a loading control. Western blot showing the phosphorylation of TBK1 in e, NPA Chek2 KO and NTC clones and in NPA glioma cells treated with Chek1/Chek2 inhibitor Prexasertib (300 nmol/L) at the indicated time points. Total TBK1 is used as a loading control. For d–e, N = 3 independent replicates. Flow cytometry analysis showing surface expression of f, PD-L1 on NPA Chek2 KO and NTC clones, at the basal level and upon stimulation with IFNγ for 48 h and g, PD-L1 on NPA glioma cells treated with Prexasertib (300 nmol/L) at the indicated time points. h Scatter plot showing correlation between T-cell infiltration and cytosolic DNA sensing-STING pathway in TCGA GBM dataset (n = 167 samples, two-tailed, Pearson correlation coefficient r = 0.53, p = 1.9e−13). i Proposed model: Chek2 depletion or pharmacological inhibition results in STING pathway activation and PD-L1 upregulation, which may sensitize gliomas to checkpoint blockade therapy. For b, c, f and g 10,000 cells/condition were analyzed over 3 independent experiments (mean ± SD, unpaired two-tailed t-test). Source data for Fig. a–g are provided as a Source Data file.

