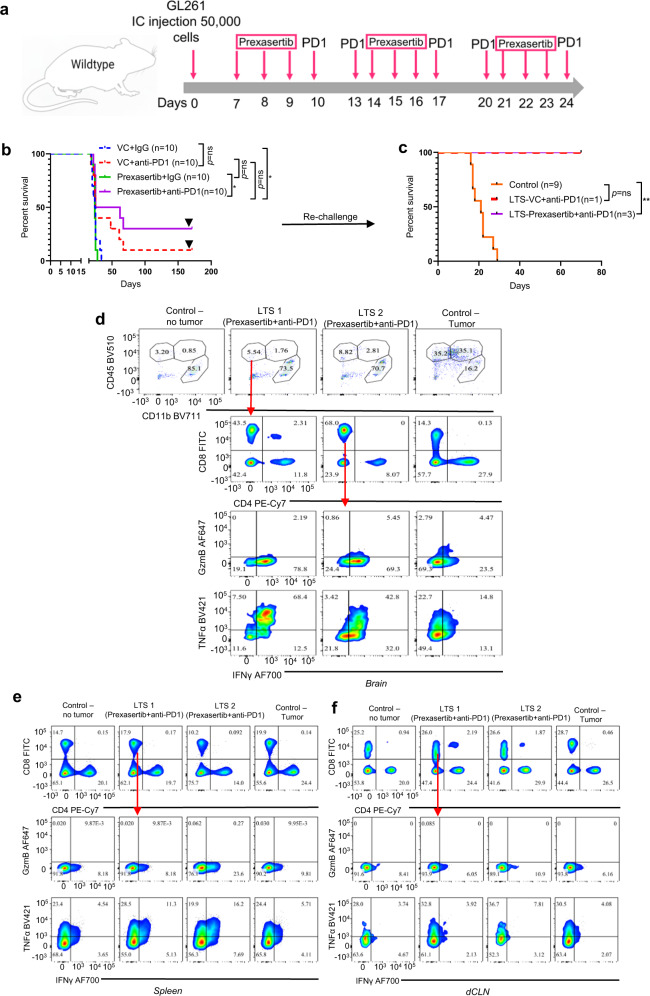
Fig. 7. Combination of Prexasertib and PD-1 blockade improves survival in glioma-bearing mice.
a The schematic representation of the dosing scheme for the survival experiment. b KM survival curves for C57BL/6 mice bearing GL261 glioma. Seven days after intracranial tumor implantation, the animals were randomized into 4 groups (10 animals/group): vehicle and isotype control (IgG), anti-PD-1, Prexasertib (Chek1/2 inhibitor), and Prexasertib and the anti-PD-1 combination group. The median survival duration in the treatment groups were as follows: VC + IgG, 24.5 days; VC + anti-PD-1, 25 days; Prexasertib + IgG, 24 days; Prexasertib + anti-PD-1, 43.5 days. Statistics: VC + IgG vs VC + anti-PD-1, p = 0.09; VC + IgG vs Prexasertib + IgG, p = 0.5; and VC + IgG vs Prexasertib + anti-PD-1, p = 0.01. c, KM survival curves for long-term survivors and naive controls that were rechallenged in the contralateral hemisphere. The median survival in the treatment groups were as follows: naive controls (9 mice), 21 days; VC + anti-PD-1 (1 mouse), undefined; Prexasertib + anti-PD-1 (3 mice), undefined. Statistics: naive control vs VC + anti-PD-1, p = 0.09; naive control vs Prexasertib+ anti-PD-1, p = 0.0062. Survival analysis for b, c was performed using the log-rank test. d Analysis of CD8 T-cell phenotype in the long-term survivors (LTS). Freshly dissected brains from Prexasertib + anti-PD-1 group, naive control (no tumor), and glioma-bearing control mice were analyzed for CD8 T-cell phenotype using flow cytometry. e Analysis of CD8 T-cell phenotype in the long-term survivors. Freshly dissected spleens from Prexasertib + anti-PD-1 group, naive control (no tumor), and glioma-bearing control mice were analyzed for CD8 T-cell phenotype using flow cytometry. f Analysis of CD8 T-cell phenotype in the long-term survivors. Freshly dissected deep cervical lymph nodes (dCLN) from Prexasertib + anti-PD-1 group, naive control (no tumor), and glioma-bearing control mice were analyzed for CD8 T-cell phenotype using flow cytometry. Statistical significance on the figure is depicted as ns: not statistically significant, *p < 0.05. Source data for b, c are provided as a Source Data file.

