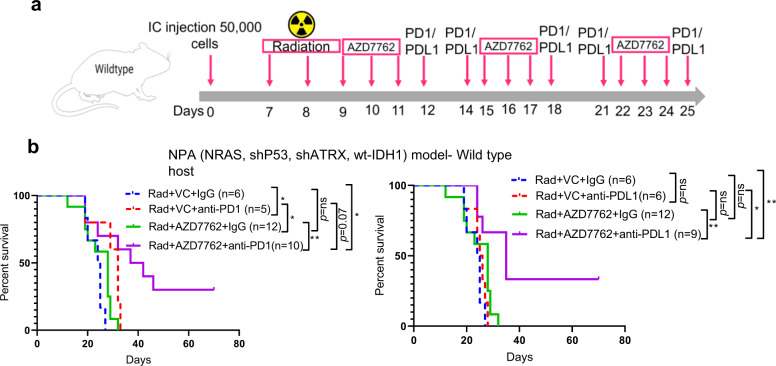
Fig. 8. The combination of radiotherapy, AZD7762 and PD-1/PD-L1 blockade improves the survival of glioma-bearing mice in NPA glioma model.
a The schematic representation of the dosing scheme followed for the survival experiment. b (Left) KM survival curves for NPA glioma-bearing C57BL/6 mice. Seven days after intracranial implantation, all the animals were irradiated with 3 Gy whole-brain radiation for 3 consecutive days. 9 days after tumor implantation, the animals were randomized into 4 groups: vehicle control (n = 6), anti-PD-1 (n = 5), AZD7762 (Chek1/2 inhibitor) (n = 12) and AZD7762 + anti-PD-1 (n = 10) combination group. Survival analysis was performed using the log-rank test. The median survival duration in the treatment groups were as follows: Rad + VC + IgG, 24.5 days; Rad + VC + anti-PD-1, 32 days; Rad + AZD7762 + IgG, 28 days; Rad + AZD7762 + anti-PD-1, 39.5 days. Statistics: Rad + VC + IgG vs Rad + VC + anti-PD-1, p = 0.02; Rad + VC + IgG vs Rad + AZD7762 + IgG, p = 0.09; and Rad + VC + IgG versus Rad + AZD7762 + anti-PD-1, p = 0.018. (Right) KM survival curves for NPA glioma-bearing C57BL/6 mice. 7 days after intracranial implantation, all the animals were irradiated with 3 Gy whole-brain radiation for 3 consecutive days. 9 days after tumor implantation, the animals were randomized into 4 groups: vehicle control (n = 6), anti-PD-L1 (n = 6), AZD7762 (Chek1/2 inhibitor) (n = 12) and AZD7762 + anti-PD-L1 (n = 9) combination group. Survival analysis was performed using the log-rank test. The median survival duration in the treatment groups were as follows: Rad + VC + IgG, 24.5 days; Rad + VC + anti-PD-L1, 25.5 days; Rad + AZD7762 + IgG, 28 days; Rad + AZD7762 + anti-PD-L1, 35 days. Statistics: Rad + VC + IgG vs Rad + VC + anti-PD-L1, p = 0.32; Rad + VC + IgG vs Rad + AZD7762 + IgG, p = 0.09; and Rad + VC + IgG versus Rad + AZD7762 + anti-PD-L1, p = 0.0065. Statistical significance on the figure is depicted as ns: not statistically significant, *p < 0.05, **p < 0.01. Source data for b are provided as a Source Data file.

