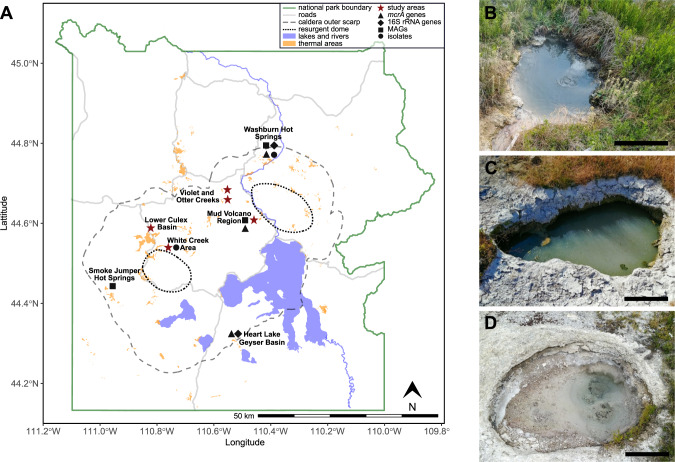
Fig. 1. Geothermal areas of Yellowstone National Park and main study sites.
A Map of Yellowstone National Park highlighting areas with potential for methanogenesis. Red stars mark areas investigated in this study. Symbols indicate where mcrA genes (triangle), 16S rRNA genes of methanogens (diamond), Mcr-encoding MAGs (square), or methanogen isolates (circle) have been recovered. Map was generated with data from the Wyoming State Geological Survey (https://www.wsgs.wyo.gov/pubs-maps/gis). Photographs of main study sites. LCB003, 2019-07-24 (B), LCB019, 2019-07-25 (C), and LCB024, 2019-07-23 (D). Scale bar indicates 30 cm.

