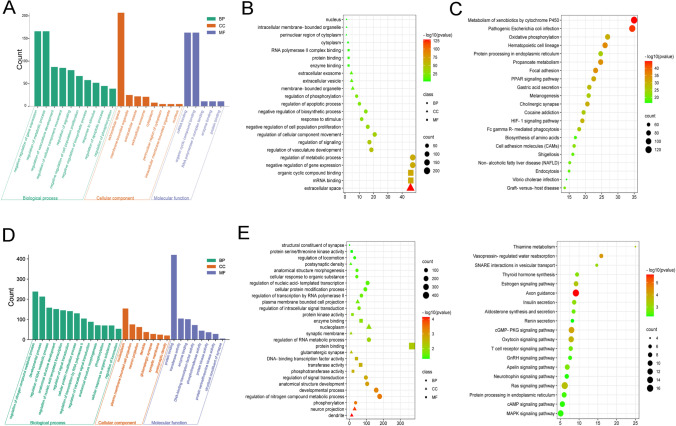
Fig. 3.
GO function annotation and KEGG pathways analysis of DEmiRNAs in FF-EVs. (A) The GO terms of 514 DEmiRNAs, including BP on the left, CC in the middle, and MF on the right. (B) Multi-class scatter plot of GO terms analysis of 514 DEmiRNAs. (C) Scatter plot of KEGG enrichment analysis of 514 DEmiRNAs. (D) The GO terms of 628 candidate predicted target genes of 6 DEmiRNAs, including BP on the left, CC in the middle, and MF on the right. (E) Multi-class scatter plot of GO terms analysis of 628 candidate predicted target genes of 6 DEmiRNAs. (F) Scatter plot of KEGG enrichment analysis of 628 candidate predicted target genes of 6 DEmiRNAs

