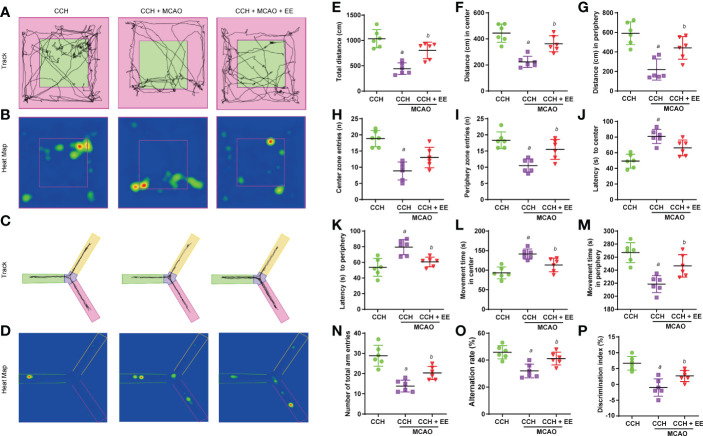
Figure 6.
Results of behavior analysis in CCH mice 21 days after MCAO. (A) Movement track of mice in open field test. (B) Heat map of mouse movement in open field test. (C) Movement track of mice in Y maze test. (D) Heat map of mouse movement in Y maze test. (E–M) Behavior analysis of open field test, including total distance (E), distance in center (F), distance in periphery (G), center zone entries (H), periphery zone entries (I), latency to center (G), latency to periphery (K), movement time in center (L) and movement time in periphery (M). (N, O) Behavior analysis of Y maze test. (P). Values represent the mean ± s.d. aP < 0.05 vs. CCH group; bP < 0.05 vs. CCH with MCAO group (n = 6).

