Figure 4.
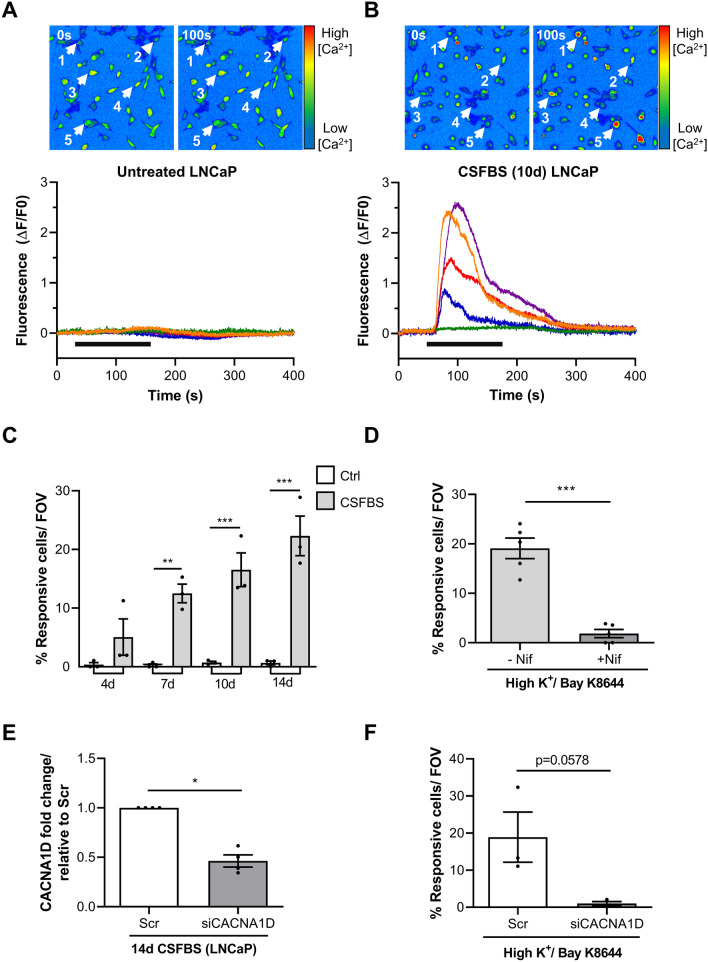
CaV1.3-mediated Ca2+ signalling emerges in LNCaP during CSFBS culturing. (A) Pseudocolour micrographs of Cal-520 AM-loaded LNCaP (cultured in media containing normal FBS) during live-cell recordings. Pseudocolour scale indicating increased fluorescence intensity from blue–green–yellow–red, indicating increased intracellular [Ca2+]. Fluorescence micrographs in normal Hanks' (0 s) and during perfusion with high K+ Hanks containing Bay K 8644 (10 µM, denoted by solid horizontal bar) (100 s) are shown. Five cells (1–5, white arrows) were selected and ΔF/F0 measured then plotted on a fluorescence intensity-time graph (coloured lines, lower panel) (N = 5 recordings). (B) Pseudocolour micrographs showing CSFBS-cultured LNCaP (10 days) pre- (0 s) and during exposure (100 s) to high K+/Bay K 8644. Fluorescence intensity of 5 selected cells demonstrating Ca2+-transients in 4 of the 5 cells (lower panel) (N = 3 recordings). (C) Mean percentage of responding cells per recording is shown at several time points during CSFBS along with matched time controls. Data analysed with 1-way ANOVA with Šídák's multiple comparison test, p < 0.05 (*), p < 0.01 (**) and p < 0.001 (***) (N = 3). (D) Nifedipine (1 µM) significantly reduced the percentage of high K+/Bay K 8644-responding cells after 10 day CSFBS. Data was analysed with unpaired t-test where p < 0.001 (***) (N = 5 recordings). (E) Significant knockdown of CACNA1D by siRNA transfection was achieved in CSBFS-treated LNCaP (14 days, Mann–Whitney, N = 4, p < 0.05 (*). (F) The percentage of high K+/Bay K8644-responsive LNCaP in siRNA-LNCaP was markedly reduced compared with scrambled controls, (p = 0.0578, unpaired t-test, N = 3).

