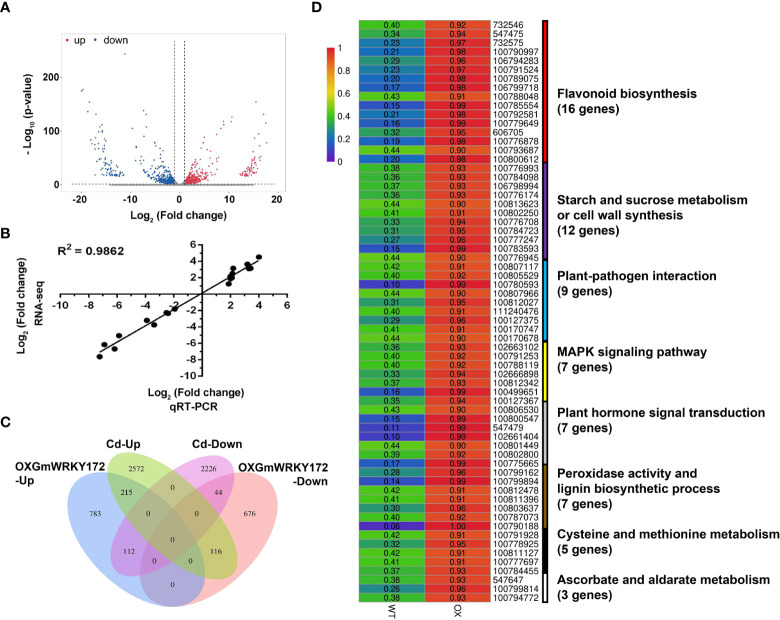
Figure 5.
Overexpression of GmWRKY172 led to extensive transcriptional reprogramming of stress-responsive genes. (A) Scatter-plot graphs of the differential gene expression patterns between overexpressing lines and WT. Red represents up-regulated genes, while blue represents down-regulated ones. (B) Validation of expression patterns of 20 DEGs by qRT-PCR assay. The correlation is R2 = 0.9862. (C) Venn diagram shows the overlap of GmWRKY172 overexpression and Cd-induced DEGs. (D) The Cd responsive KEGG pathways among the differentially expressed genes.

