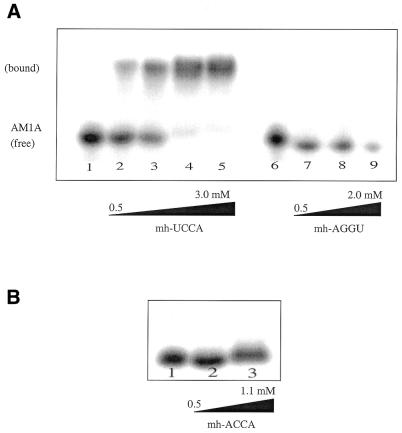
Figure 7.
Native gel studies of AM1A with microhelix tRNA models (15% acrylamide). (A) Lanes 1–5 contain 5′-32P-end-labeled AM1A with concentrations of complimentary microhelix (mh-UCCA) of 0, 500, 989, 2967 and 3956 µM, respectively. Lanes 6–9 contain 5′-32P-end-labeled AM1A with concentrations of the complete mismatch microhelix (mh-AGGU) of 0, 500, 989 and 1978 µM, respectively. A Kd of 830 µM was determined for the complimentary minihelix, while the complete mismatched microhelix failed to show an observable complex with AM1A. (B) Same conditions as (A) except using the discriminator mismatch microhelix (mh-ACCA) at concentrations of 0, 277 and 1108 µM in lanes 1–3, respectively. Although no clear shift occurs, there does appear to be a smearing of the band at higher concentrations.

