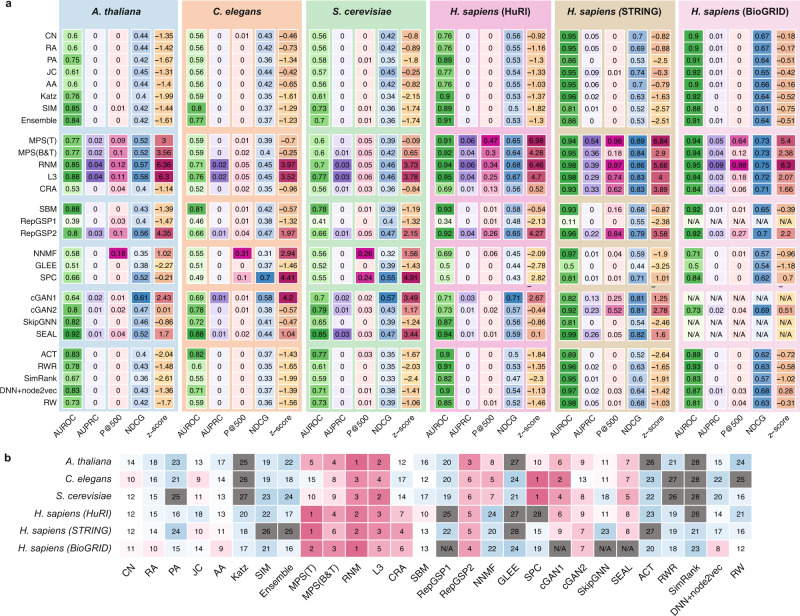
Fig. 3. Computational evaluation of the PPI prediction methods.
The details of each method are summarized in Table 1. a Heatmap plots show the performance of each method on each interactome with the following evaluation metrics: AUROC, AUPRC, P@500, and NDCG. The overall performance is calculated from z-scores of three metrics. For each metric, darker color represents better performance. b The ranking of the 26 methods on the six interactomes by z-scores. Note that, the performances of ReGSP1, cGAN1, SEAL and SkipGNN on the BioGRID database were not evaluated due to the prohibitive computational cost. We marked their rankings as N/A. Note that AUROC was excluded in calculating the combined z-score and ranking for each method.

