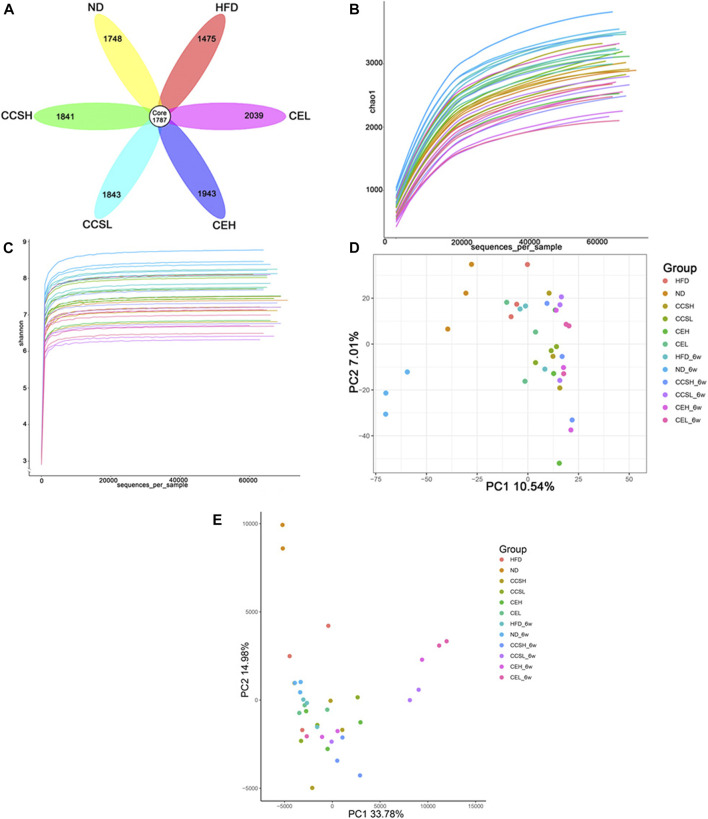
FIGURE 2.
CCS and CE modulate the community structure of the gut microbiota. (A) OTUs petal images of each treatment group after 4 weeks of gavage. Core OTUs represent OTUs common to all groups, and numbers on petals represent OTUs unique to each group. (B) Sparse curve (C) Shannon index (D) PCA principal component analysis (E) Euclidean-based PcoA.

