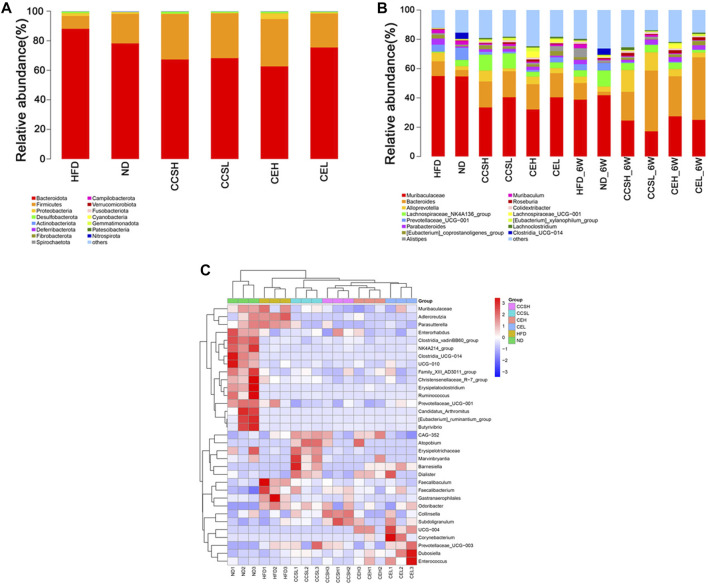
FIGURE 3.
Effects of CCS and CE on the community structure of gut microflora in T2DM. (A) The distribution of community structure at the phylum level of each treatment at the fourth week after gavage group (Top 15); (B) Community structure distribution of each treatment group at the fourth and sixth week of gavage at the genus level (Top 15); (C) Heatmap analysis of the differential species of gut microbes at the genus level at the fourth week of gavage.

