. 2022 Dec 2;14(3):444–453. doi: 10.1039/d2md00360k

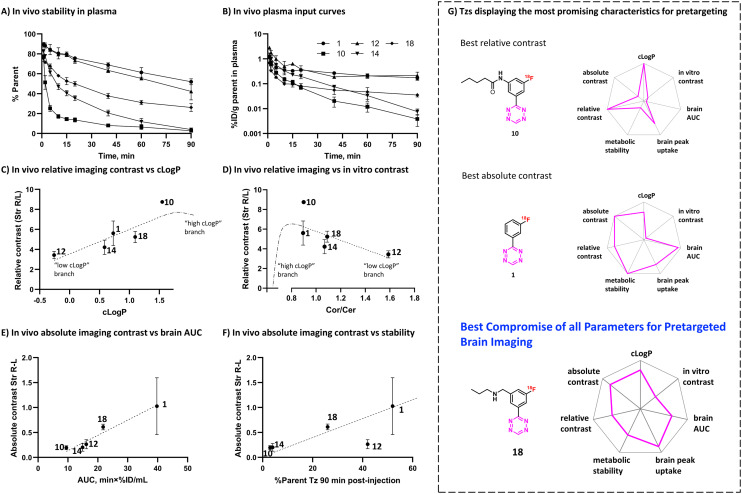
Fig. 5. A) In vivo metabolic stability of selected Tzs in rat plasma B) metabolite-corrected arterial plasma input curves for selected Tzs. C and D) Correlation of relative imaging contrast with clog P and in vitro contrast, respectively. Dash-dot lines represent putative non-monotonous relationships for highly lipophilic Tzs, E) correlation of absolute imaging contrast with in vivo brain AUC, F) correlation of absolute imaging contrast with in vivo metabolic stability of 18F-Tzs. Dashed line represents putative trend without 12. G) Summary rankings of Tzs displaying the most promising characteristics for pretargeting beyond the BBB. Rankings are relative to other Tzs. [18F]18 was identified to possess the best parameters.

Fig. 5