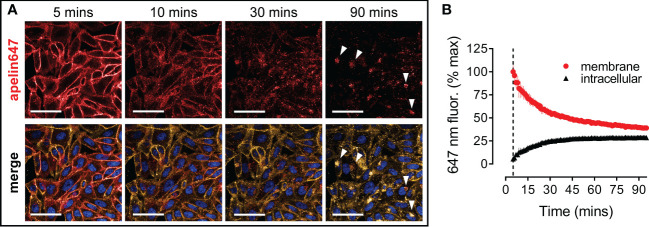
Figure 4.
Apelin647 induces apelin receptor internalisation that can be visualised using high content imaging. (A) Representative confocal fluorescent images of CHO-APLNR cells treated with 300 nM apelin647 over a 90 minute time-course (imaging commenced at 5 mins). Bottom row shows a merge with wheat-germ agglutinin-555 membrane marker (visualised in gold) and Hoechst 33342 nuclear marker (visualised in blue). White arrows indicate perinuclear staining. Scale bars indicate 50 µm. n = 3 independent experiments. (B) Quantified membrane (●) and intracellular (▲) localisation of apelin647 fluorescence (expressed as % max membrane fluorescence observed at time 5 mins) over the 90 minute time-course. Data are expressed as mean ± s.e.m., pooled from n = 3 independent experiments.

