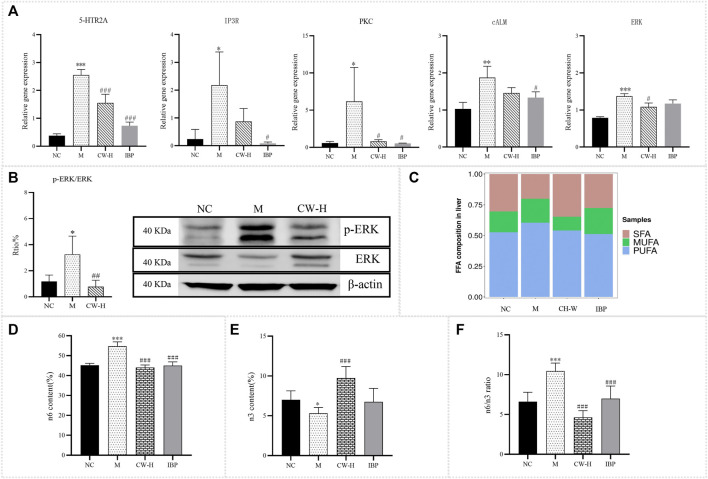
FIGURE 5.
RT-qPCR, WB, and FA metabolomics results of CW against PD. (A) Gene expression levels of 5-HTR2A, IP3R, PKC, cALM, and ERK in the uterine tissues of rats in each group (x‾ ± s, n = 3). (B) Protein expression levels of p-ERK and ERK in the uterine tissues of rats in each group (x‾ ± s, n = 3). (C) The proportion of SFA, MUFA, and PUFA in liver tissues (x‾ ± s, n = 6). (D) n6 PUFAs (x‾ ± s, n = 6). (E) n3 PUFAs (x‾ ± s, n = 6). (F) n6/n3 ratio (x‾ ± s, n = 6). Compared with the NC group, *p < 0.05, **p < 0.01, ***p < 0.001; compared with the M group, # p < 0.05, ## p < 0.01, ### p < 0.001. NC, Normal control group; M, Model group, CW-H, CW high-dose group; IBP, Ibuprofen positive control group.

