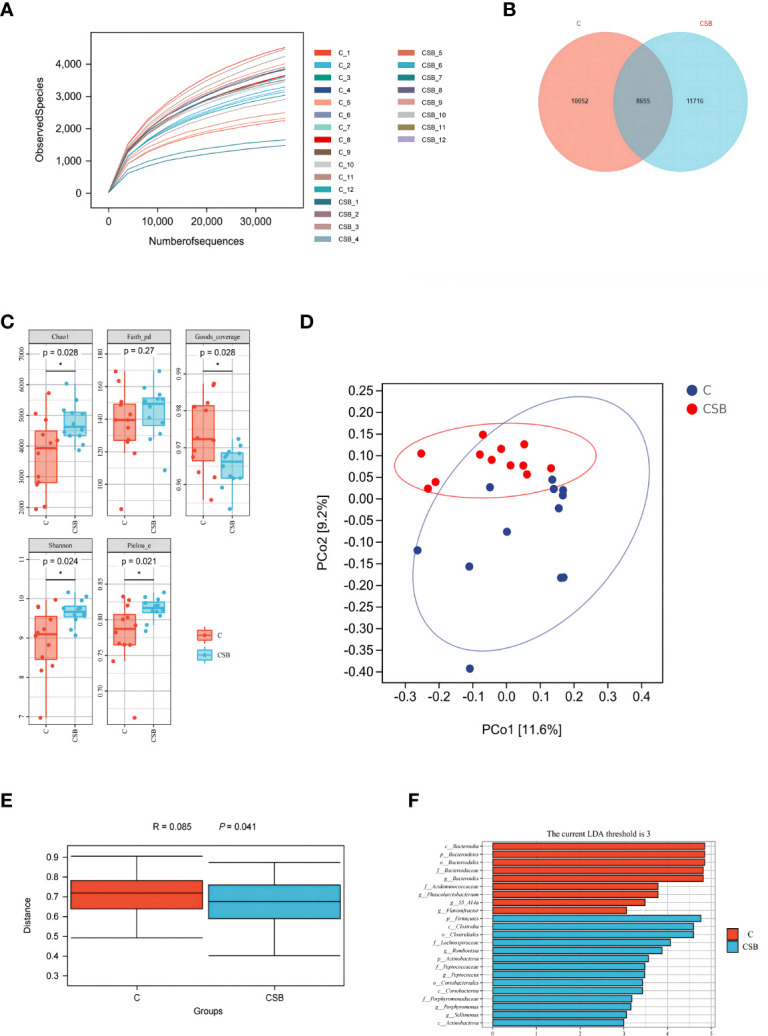
Figure 7.

Effects of dietary supplementation of coated sodium butyrate (CSB) on cecum microbiota in laying ducks. (A) Rarefaction curves. (B) Venn diagram of the amplicon sequence variants (ASVs). (C) Chao1, Faith’s phylogenetic diversity (PD), Good’s coverage, Shannon, and Pielou’s evenness (Pielou-e) α-diversity indices. (D) principal coordinate analysis (PCoA) of taxonomical classifications of the cecal bacterial communities. (E) weighted_unifrac distance. (F) linear discriminant analysis effect size (LEfSe) analysis (LDA threshold = 3). Values are presented as means ± SEM (n = 12). *p<0.05. group C, Control group, which was fed a basal diet; CSB group, CSB-treated group, which was fed the basal diet supplemented with 250 g/t of CSB.
