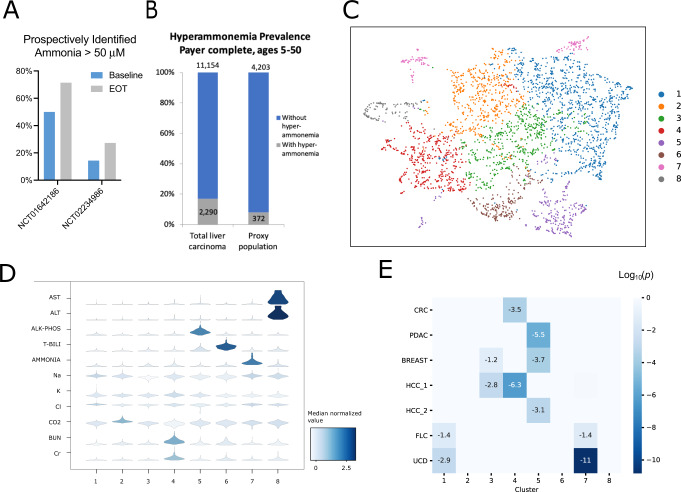
Fig. 2. Characterizing FLC-associated hyperammonemia.
A Incidence of hyperammonemia at baseline and end of treatment (EOT) for patients participating in two successive FLC clinical trials. Prospective assessment at the screening was instituted partially through NCT01642186 and performed from the initiation of NCT02234986. Patients were included in baseline and EOT cohorts if a value had been collected at that time. B Relative prevalence of hyperammonemia diagnostic coding in all liver carcinoma patients (e.g., including hepatitis diagnostic codes) vs. FLC proxy population, showing lower rates of detected hyperammonemia in the non-cirrhotic cohort. C Umap of entire concurrent complete metabolic profile results in all patients with laboratory evidence of hyperammonemia at UCSF, demonstrating subgroups of distinct clinical phenotypes. D Violin plots of individual lab values within each cluster from C; color shows median values while plot morphology indicates relative distribution. E Fisher exact test for enrichment of patients with selected diagnoses into clusters: Colorectal cancer (CRC), breast cancer, pancreatic cancer (PDAC), HCC with cirrhosis (HCC1), HCC without cirrhosis (HCC2), FLC, and primary urea cycle disorders (UCD).

