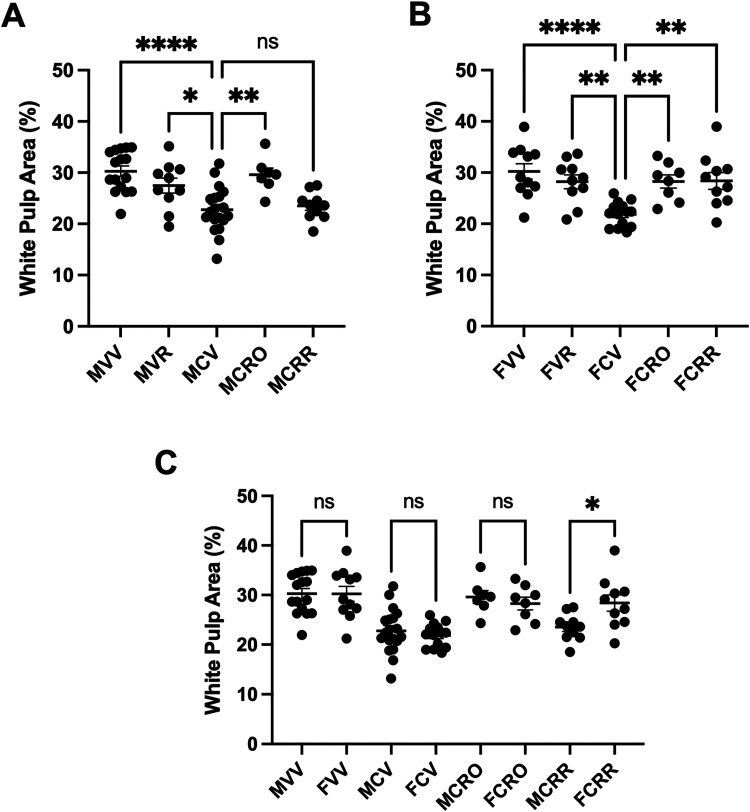
Figure 3.
Evaluation of H&E-stained spleen sections for a percentage of area occupied by white pulp. (A) White pulp areas in male treatment groups. (B) White pulp areas in female treatment groups. (C) White pulp comparison of sexes by treatment group.
M: male; F: female; VV: vehicle/vehicle; VR: vehicle/Reelin; CV: corticosterone/vehicle; CRR: corticosterone/repeated Reelin; CRO: corticosterone/Reelin – one shot Alt text: (A) Graph of spleen white pulp % area from the males in each condition showing C/V had less white pulp, whereas C/RO has a recovery of white pulp, C/RR does not. (B) Graph of spleen white pulp % area from the females in each condition showing C/V had less white pulp, whereas C/RO and C/RR have recovery of white pulp. (C) Graph comparing white pulp % area of males and females in each condition, showing only the repeated Reelin groups are significantly different, with females having more white pulp than males.

