
FIGURE 2.
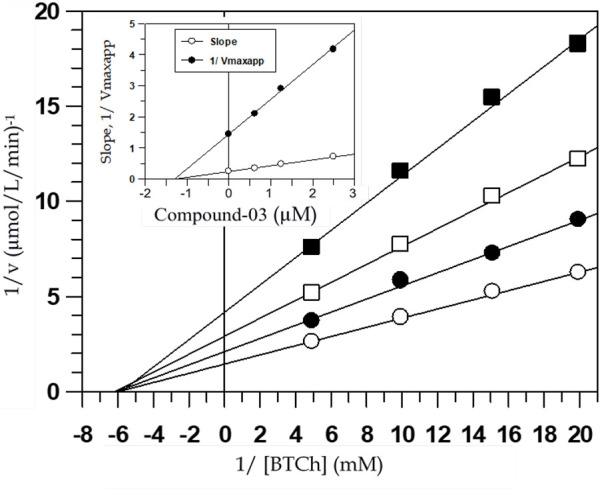
Lineweaver-Burk plot of reciprocals of the initial velocities versus reciprocals of BTCh in the absence (○) and presence of 1.25 µM (●), 2.5 µM (□) and 5 µM (■) of compound-03 against BChE. Inside frame shows the secondary replots of the Lineweaver-Burk plot: 1/Vmaxapp or Slope versus various concentrations of inhibitor, the correlation coefficient for all the lines of all the graphs was >0.99, each point in all the graphs represents the mean of three experiments.