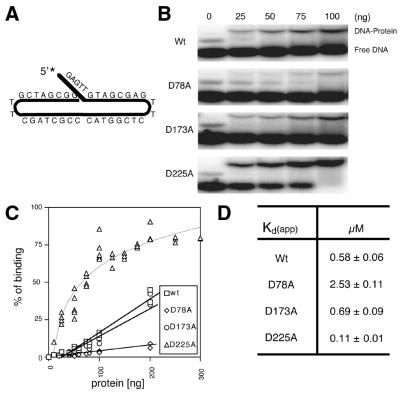
Figure 3.
Binding affinities of wild-type (Wt) and mutant Exo1 proteins. (A) Depiction of the continuous 5 nt 5′-flap substrate (5′-GAG TTG TAC CGA GTT CTC GGTACC CGCTAG CTT GCT AGC GG-3′) used in binding experiments. (B) Representative EMSA. An aliquot of 1 pmol of DNA substrate was incubated with different amounts of protein (indicated) and binding reactions were analyzed on a 5% non-denaturing gel (see Materials and Methods). The positions of the protein–DNA complex (DNA-Protein) and unbound DNA (Free DNA) are shown. (C) Binding plot of the Exo1 proteins. Percent binding was determined as [(bound value)/(bound value + unbound value)] × 100 by phosphorimager quantification. Proteins (ng) are indicated. (D) Apparent Kd of Exo1 proteins. Apparent Kd values were determined as the protein concentration that results in 50% of labeled DNA substrate being bound. Values shown are the average and standard deviation of three different experiments.

