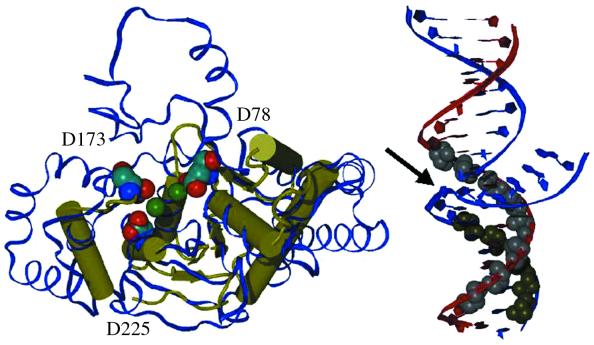
Figure 7.
Summary model of the Exo1–DNA interface. (Left) The active site residues of hExo1 characterized herein. A hExo1 active site model (yellow protein structure diagram) was achieved by structural and multiple sequence alignments [Ceslovas Venclovas, Lawrence Livermore National Laboratory; see Nucleic Acids Research, 26 (16), cover]. Residues D78, D173 and D225 of hExo1 are shown as space-filled atoms. Also shown is the Methanococcus jannaschii Fen1 structure (blue ribbon diagram; 29) and the two Mn2+ ions in its active site (green, space-filled). The model of hExo1 and the MjFen1 structure were aligned using the LGA program (52). (Right) The DNA protection sites of hExo1 on a 5′-flap substrate based on the footprinting experiments (Fig. 6). The protected sites are indicated by space-filled atoms for the corresponding sugars. Because DNA hydrolysis requires direct contact with Mn2+ ions, the DNA likely binds with the branch point (arrow) between the active site Mn2+ ions shown in the image on the left. The figures were was created with vmd (53) using STRIDE (54) and raster 3D (55).

