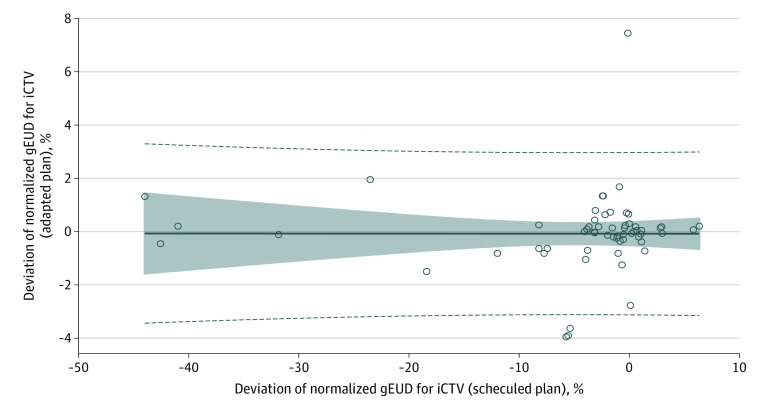
Figure 2. Scatterplot of Normalized Generalized Equivalent Uniform Dose (gEUD) Deviation Values for Interfractional Clinical Target Volume (iCTV) Using the Adapted Plan vs Normalized gEUD Deviation Values Using the Scheduled Plan.
The gEUD deviation values for iCTV using the adapted plan remained independent from those using the scheduled plan (r = 0.00). The dashed lines indicate 95% CIs for individual new estimates, the shaded area indicates the 95% CIs for expected estimated values, and the solid line indicates the adaptation line.

