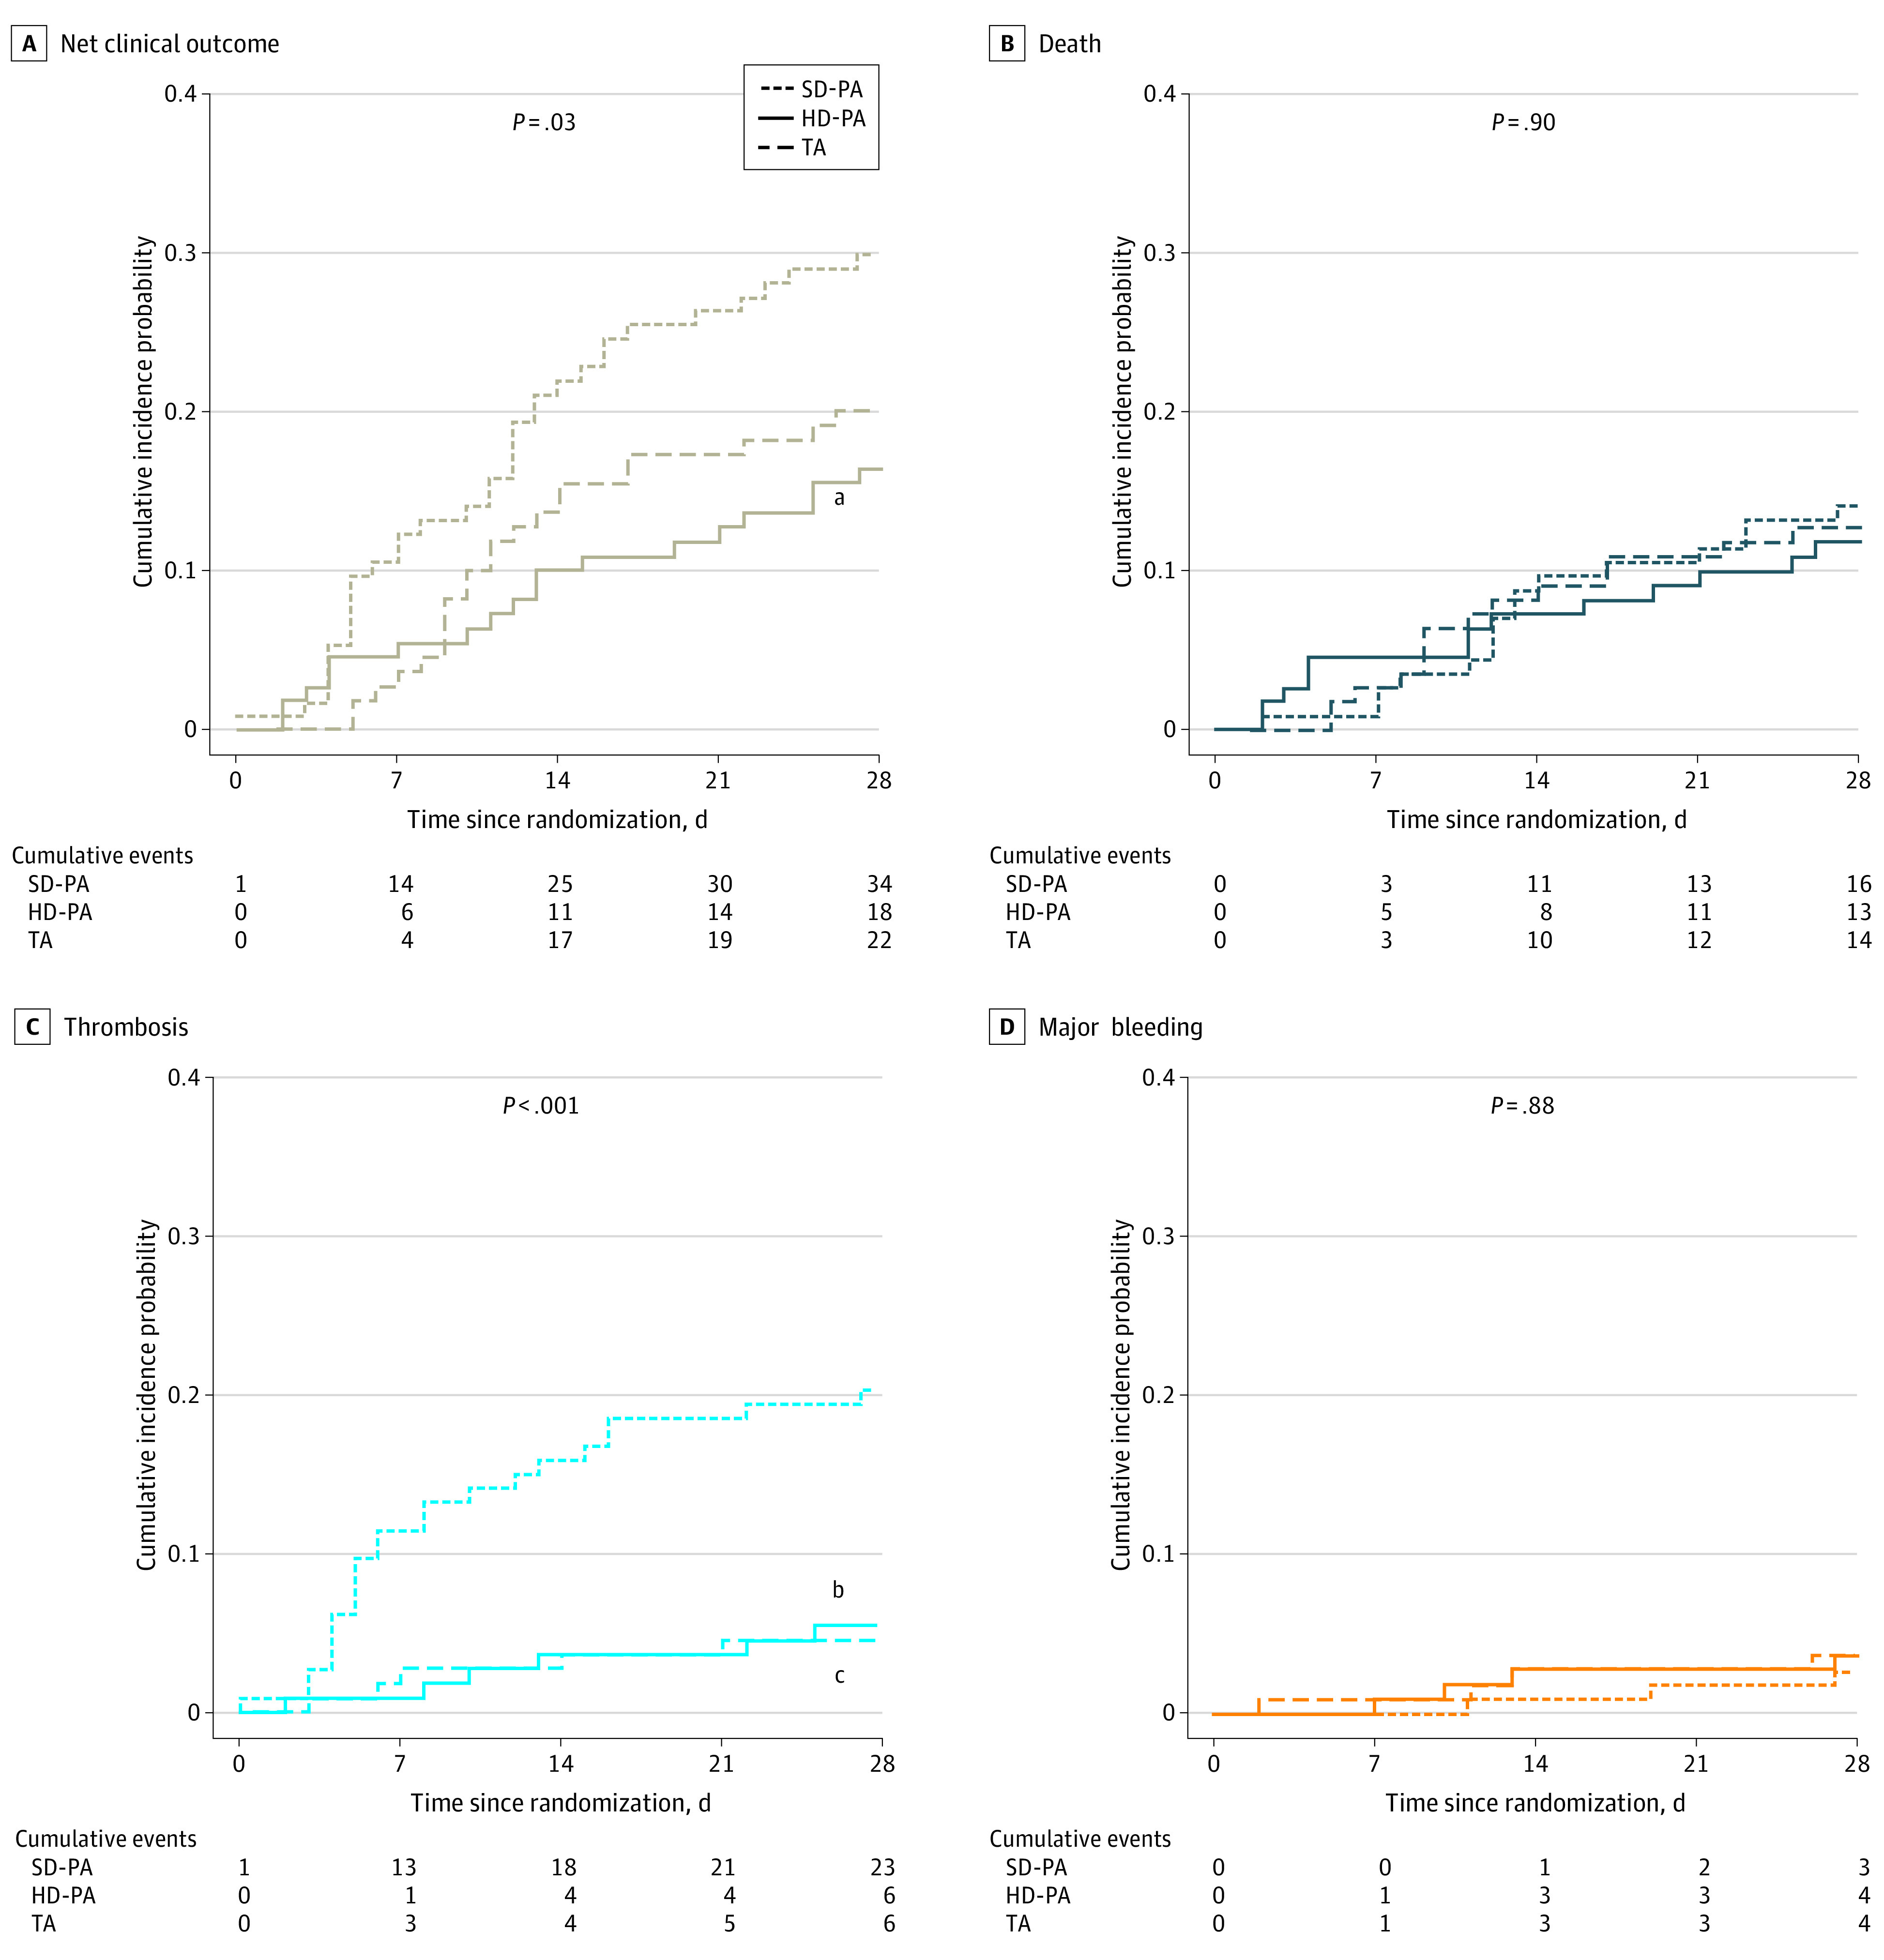
Figure 2. Net Clinical Outcome of SD-PA, HD-PA, and TA Through day 28 Among the 3 Study Groups.

A, Cumulative net clinical outcome curves, including any composite thrombotic event, major bleeding, and all-cause death. B, Cumulative mortality curves. C, Cumulative thrombosis curves. D, Cumulative major bleeding curves. P-values shown in the graphs are for global comparison of cumulative incidence curves using Gray test. HD-PA refers to high-dose prophylactic anticoagulation; SD-PA, standard-dose prophylactic anticoagulation; and TA therapeutic anticoagulation.
aP = .01 for comparison of HD-PA vs SD-PA.
bP < .001 for comparison of HD-PA vs SD-PA.
cP < .001 for comparison of TA vs SD-PA.
