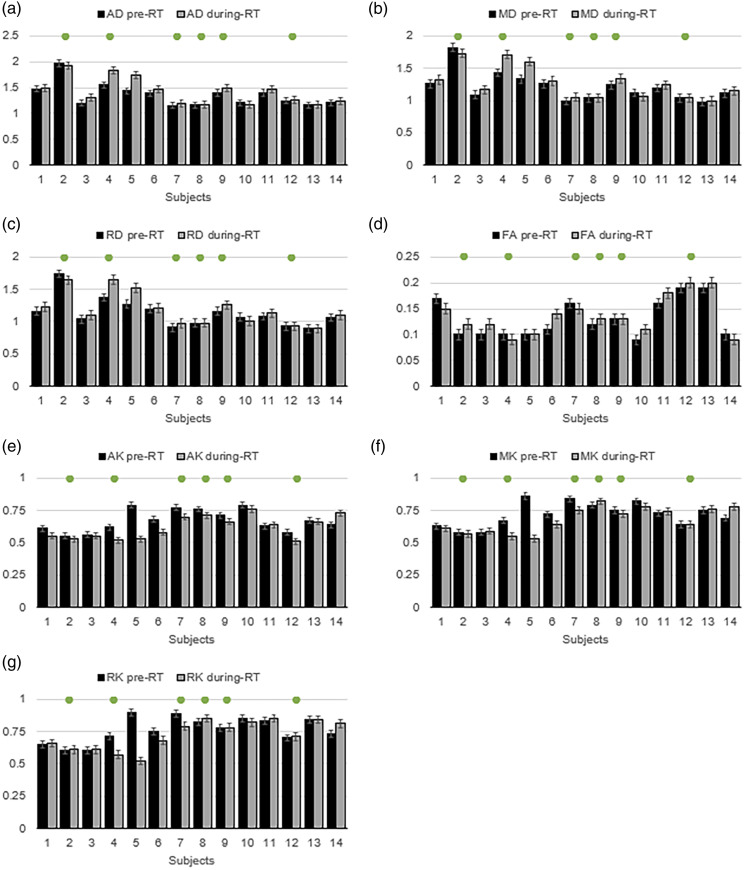
Figure 3.
Mean value of the diffusion metrics of AD (a), MD (b), RD (c), FA (d), AK (e), MK (f), and RK (g) in the active tumor region for the 14 subjects at the two imaging time points before and after 3-weeks of radiotherapy treatment. The subjects that show a clinical PFS >180 days are marked by the green dots in each graph.

