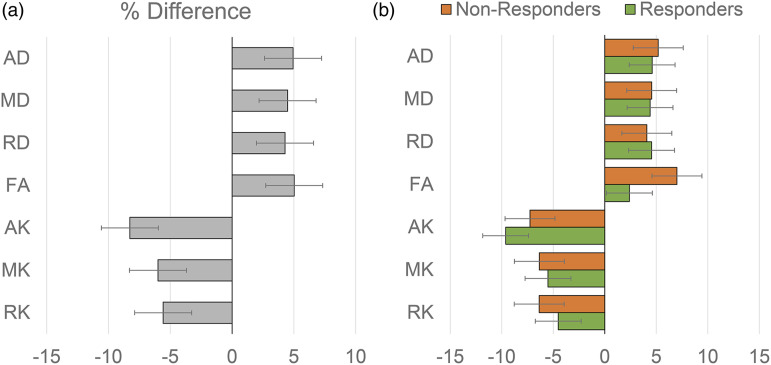
Figure 4.
Mean percentage difference of the diffusion metrics in the active tumors between the pre-RT and during-RT scans with positive percent changes indicating an increase in the diffusion metric in the during-RT scan as compared to the pre-RT scan and vice-versa with all subjects pooled together (a) and with responders and non-responders shown separately (b).

