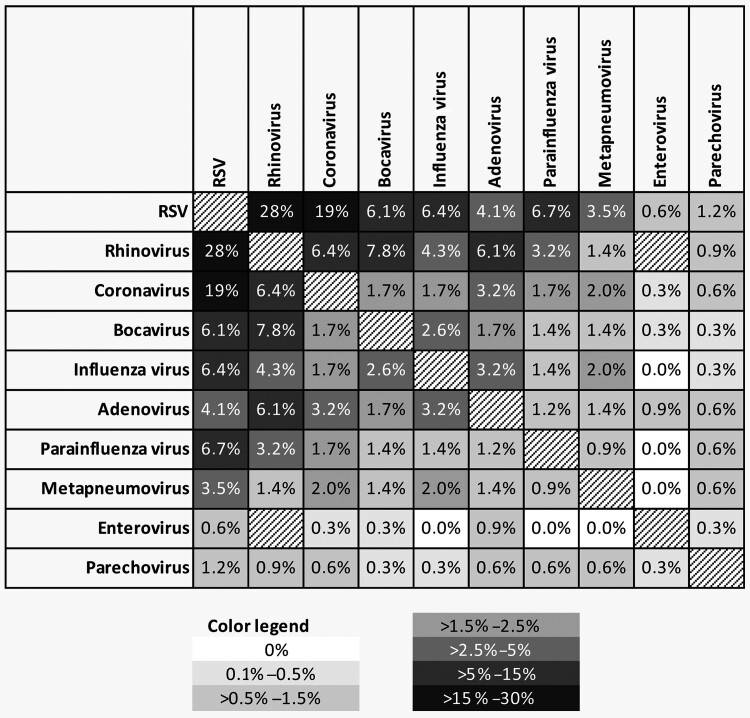
Figure 4.
Schematic representation of the frequency of viruses detected in coinfections, expressed as percentage based on the number of patients with ≥2 respiratory pathogens (n = 345). The degree of shading corresponds to the frequency of each coinfection. Data are mirrored diagonally. Coinfections of rhinovirus and enterovirus were excluded from the analysis according to limitations of the multiplex assay (see Methods). Abbreviation: RSV, respiratory syncytial virus.

