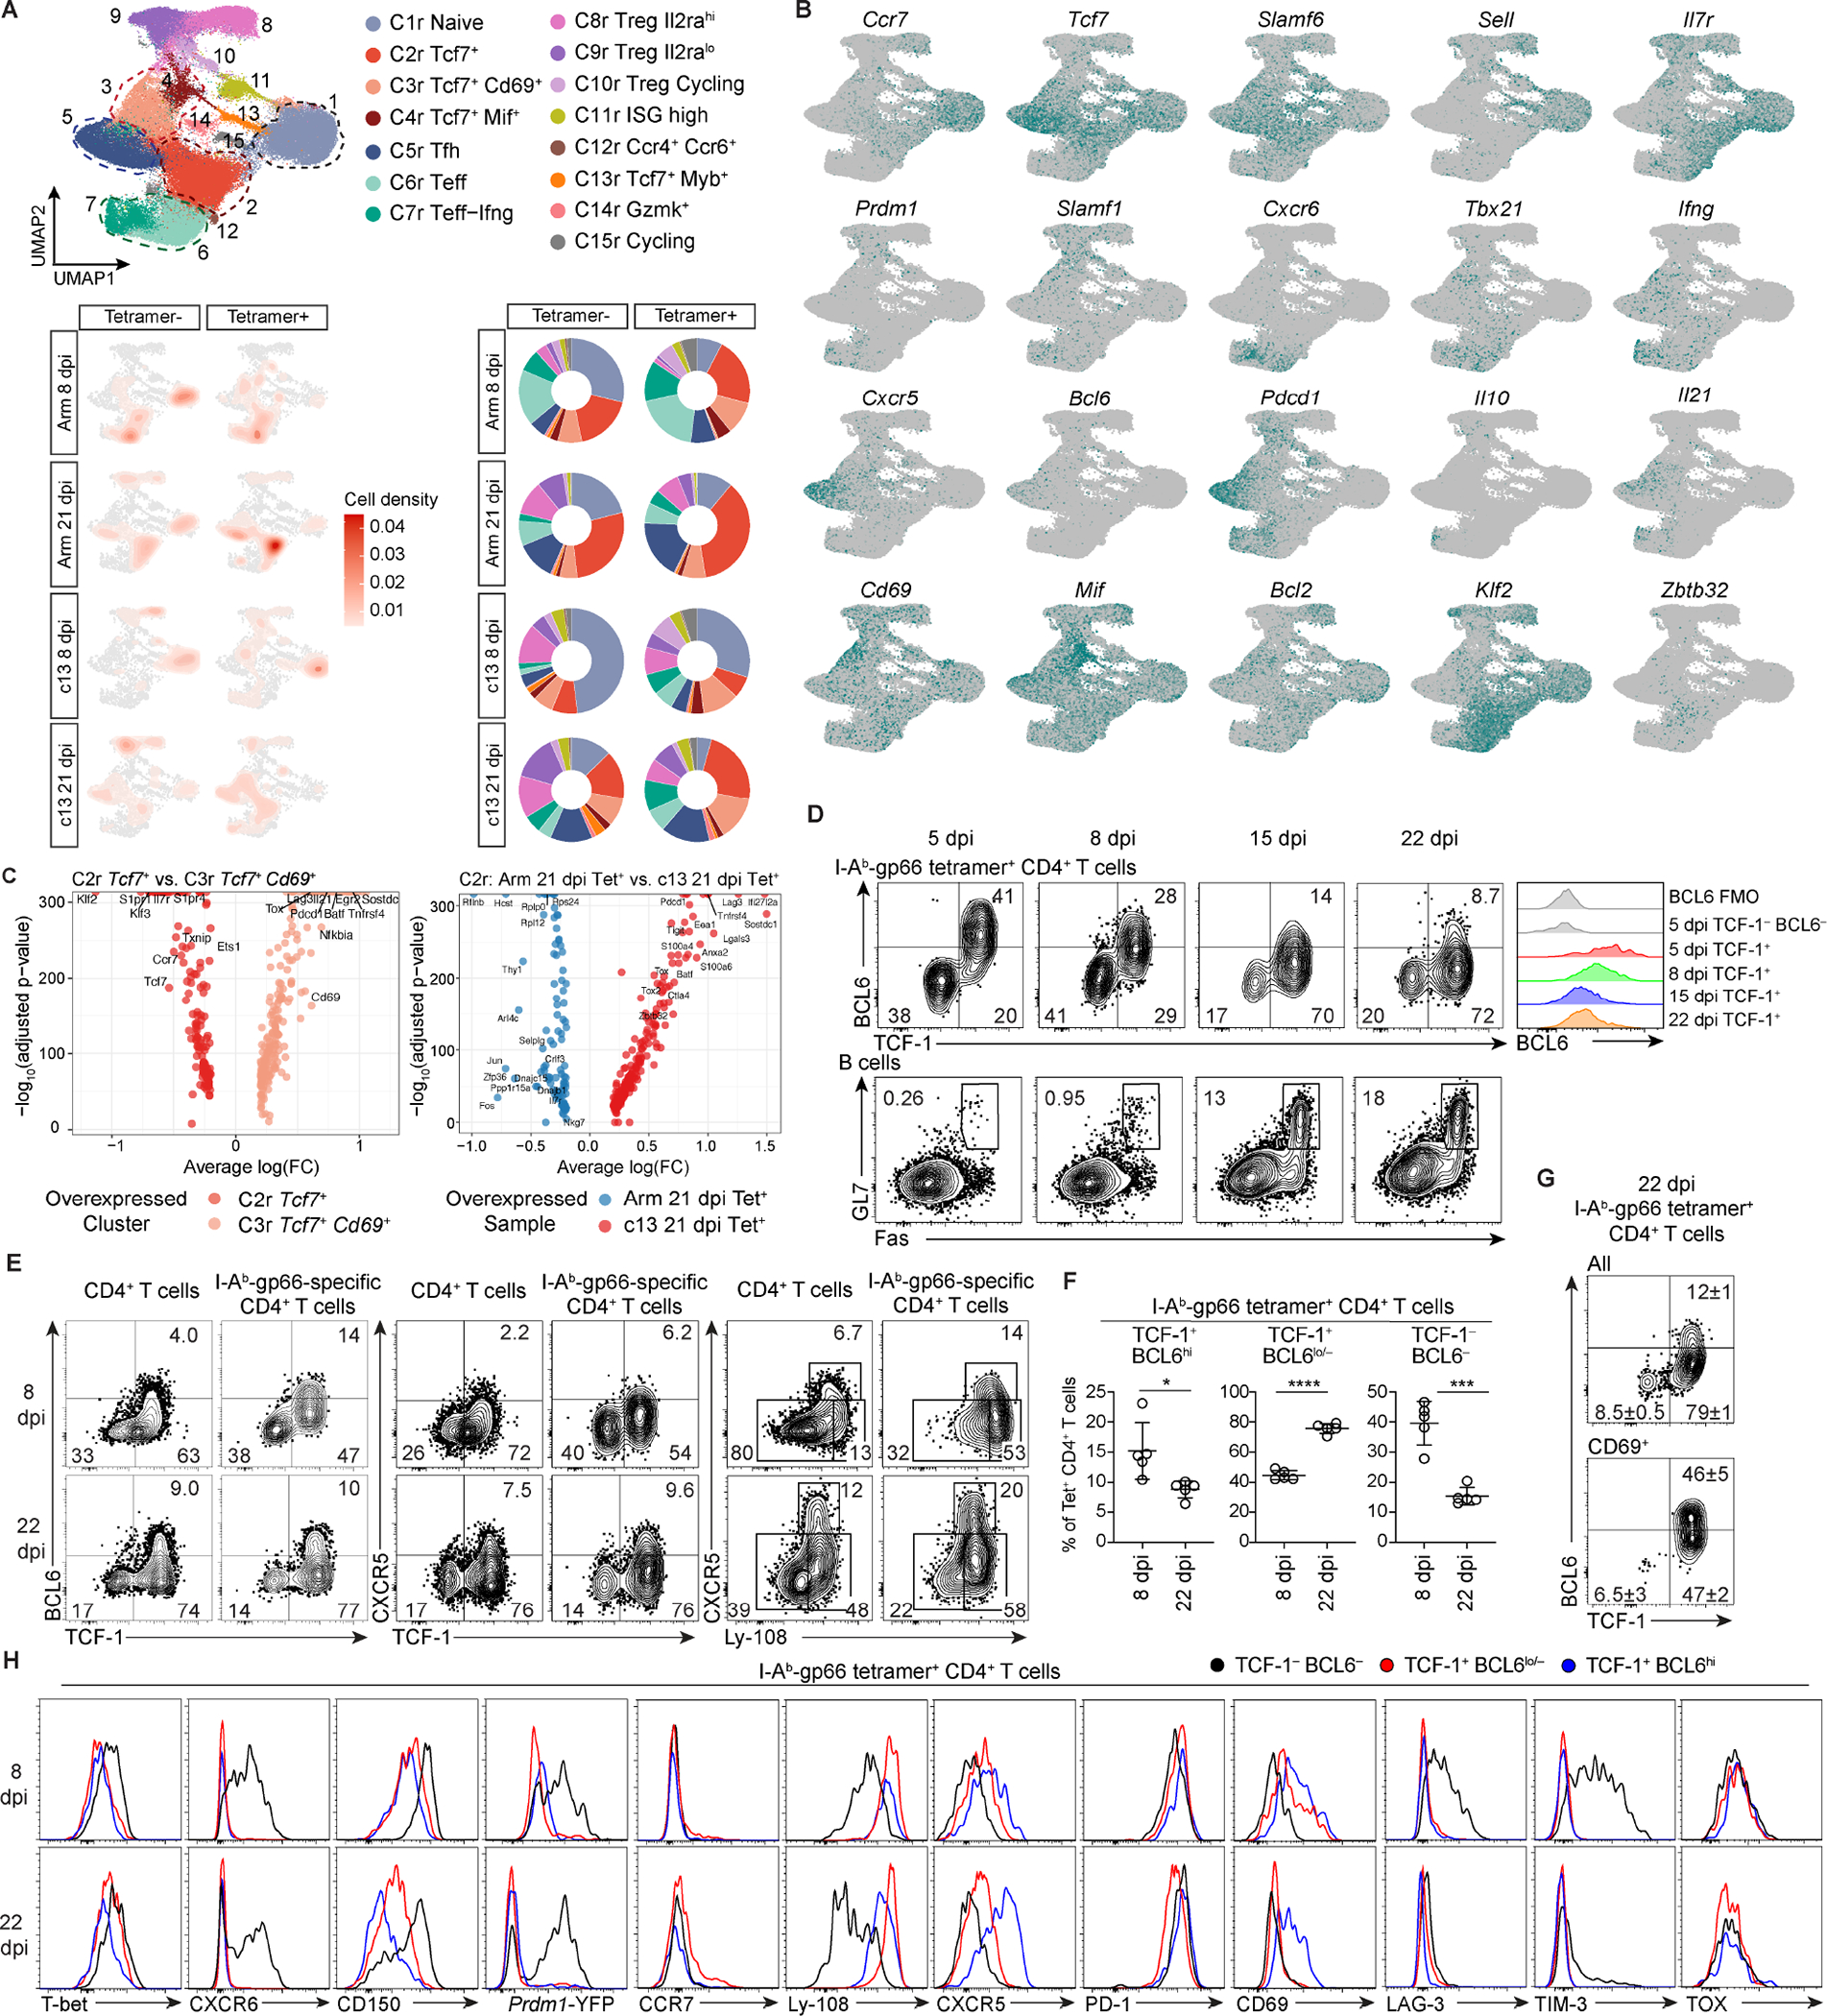
Figure 1. scRNA-seq and flow analysis reveals heterogeneity within antigen-specific CD4+ T cells in chronic LCMV infections. (See also Figures S1, S2, Table S1 and S2).

(A) UMAP of gp66 Tet+ and Tet− splenic CD4+ T cells in mice infected with LCMV-Arm or LCMV-c13 on 8 and 21 dpi. Cells were clustered by scRNA-seq gene expression profiles and colored by phenotypic clustering (top). Density UMAP of CD4+ T cells from each condition and tetramer-sorted population (bottom left). Proportion of cells from each condition in each phenotypic cluster (bottom right).
(B) Expression of cluster-defining markers.
(C) Differential gene expression of cells in the resting memory cluster C2r compared to the activated memory-like cluster C3r (left). Differential gene expression of gp66-Tet+ resting memory C2r cells from 21 dpi-LCMV-Arm compared to 21 dpi-LCMV-c13 samples (right).
(D-F) Expression of TCF-1, BCL6, CXCR5, and Ly-108 by gp66-specific splenic CD4+ T cells and expression of Fas and GL7 in splenic B cells in LCMV-c13-infected B6 mice at indicated time points. Representative flow plots (D) and pooled data for the frequencies of each PD-1+ CD4+ T cell population from 2 experiments (n = 2–3 / experiment) shown as mean±SD in (F). Unpaired t-test.
(G) Expression of indicated proteins or a Prdm1-YFP reporter in gp66-specific splenic CD4+ T cell subpopulations in LCMV-c13 infected B6 mice. Data are representative of 2 experiments with n = 2–3 / experiment.
