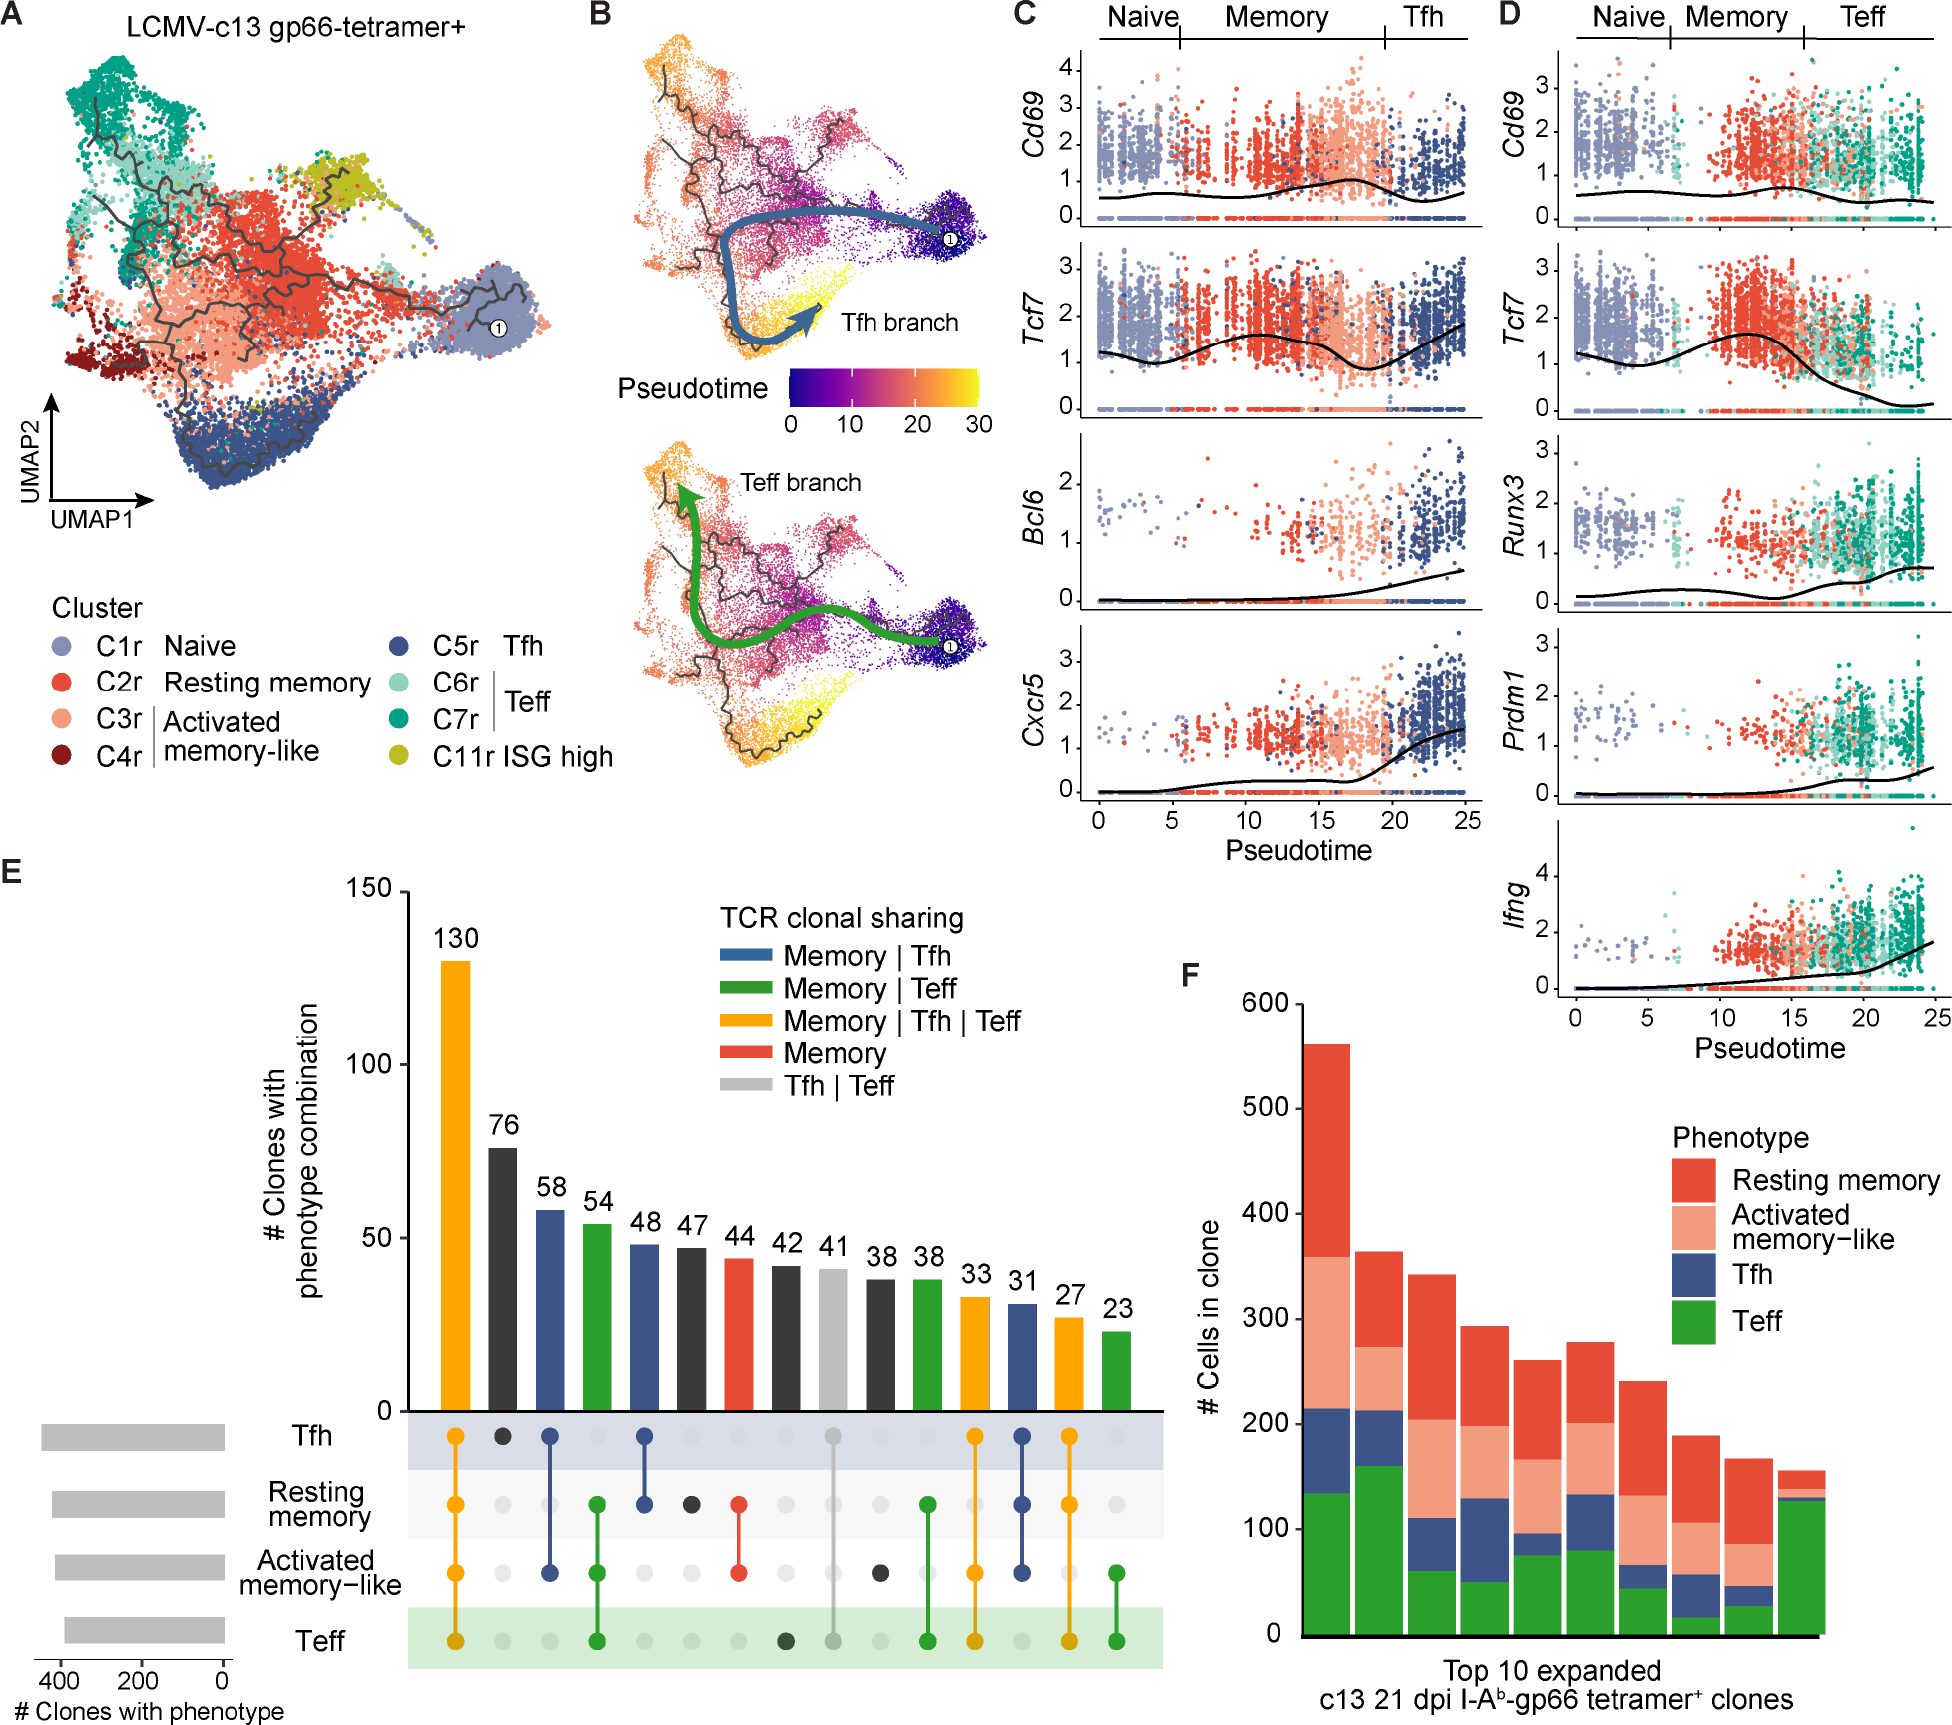
Figure 2. Memory-like cells are enriched for common progenitors for both Tfh and Teff cells. (See also Figure S3, Tables S1 and S2).

(A) UMAP trajectory graph of gp66-Tet+ CD4+ T cells from LCMV-c13 infected B6 mice on 8 and 21 dpi colored by phenotypic clusters as in Fig. 1A. The Treg clusters and other infrequent populations were excluded from the trajectory analysis for clarity.
(B) UMAP trajectory of gp66-Tet+ CD4+ T cells from LCMV-c13 infected B6 mice on 8 and 21 dpi along the Tfh branch (top) or Teff branch (bottom). Cells are colored by pseudotime.
(C) Gene expression dynamics of activation and Tfh lineage markers along the Tfh pseudotime trajectory.
(D) Gene expression dynamics of activation and Teff markers along the Teff pseudotime trajectory.
(E) Phenotypic overlap of expanded (>1 cell) T cell clones among the resting memory, activated memory-like, Tfh, and Teff clusters. Bars are colored by the category of clonal phenotypic overlap.
(F) Phenotypic composition of the top 10 most highly expanded gp66-Tet+ clones from LCMV-c13-infected B6 mice on 21 dpi.
