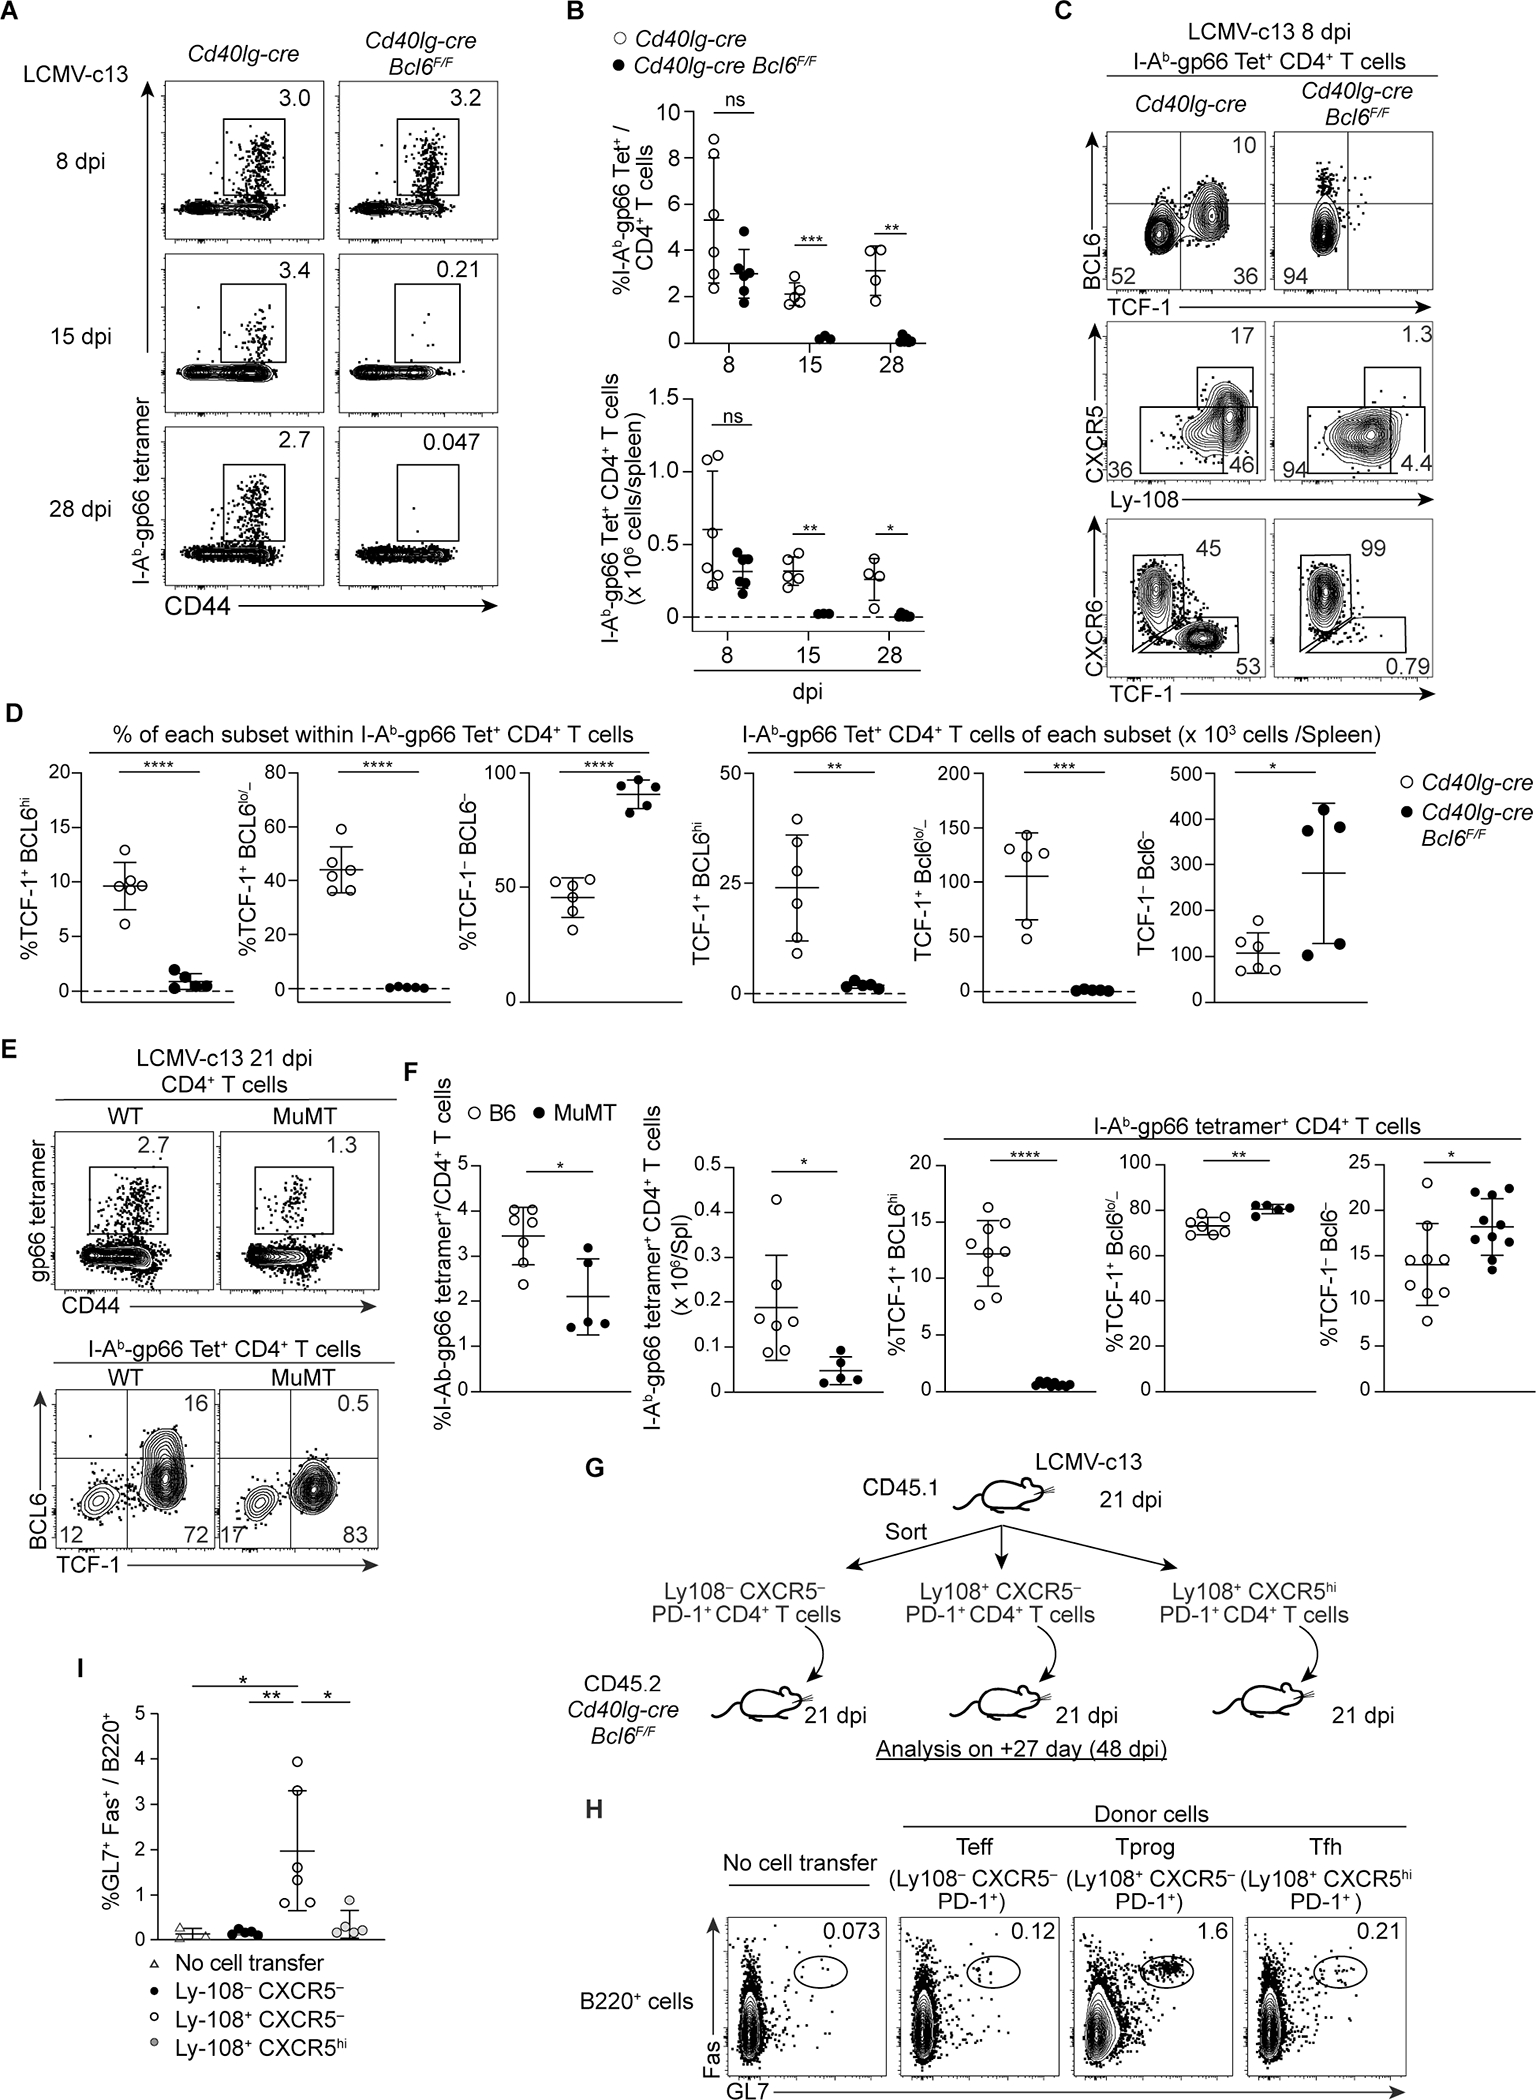
Figure 5. The maintenance of TCF-1− Teff cells requires BCL6-dependent, B cell-independent, TCF-1+ BCL6lo/− PD-1+ memory-like CD4+ T cells. (See also Figures S6 and S7).

(A-B) Representative plots showing expression of CD44 and gp66-specific TCR in splenic CD4+ T cells in Cd40lg-cre Bcl6F/F and control Cd40lg-cre mice infected with LCMV-c13, analyzed on 8 dpi, 15 dpi or 28 dpi. Pooled data from 2 experiments with 2–3 mice/group/time point are shown with mean±SD. Unpaired t-test.
(C-D) Expression of TCF-1, BCL6, Ly-108, CXCR5 and CXCR6 in gp66-specific splenic CD4+ T cells from LCMV-c13-infected Cd40lg-cre Bcl6F/F and control Cd40lg-cre mice on 8 dpi. Data pooled from two experiments with n = 2–4 / genotype shown with mean±SD.
(E-F) Expression of TCF-1, BCL6 and CXCR6 in gp66-specific splenic CD4+ T cells from LCMV-c13-infected MuMT and age-matched B6 (WT) mice on 21 dpi. Data from two experiments with n = 2–5 / genotype / experiment shown with mean±SD.
(G-I) Adoptive transfer of distinct PD-1+ CD4+ T cell populations from LCMV-c13 infected B6-CD45.1 mice to infection-matched Cd40lg-cre Bcl6F/F recipients (CD45.2).
Experimental design (G): adoptive transfer of 0.7–1 × 10⁶ cells of donor PD-1+ CD4+ T cells to infection-matched Cd40lg-cre Bcl6F/F recipients. 27 days after transfer, frequencies of splenic GL7+ Fas+ B cells in recipient mice were analyzed. Representative plots (H) and pooled data from 2 experiments (n = 2–4 / group / experiment) shown in (I) with mean±SD with statistical analysis by One-way ANOVA.
