

Abstract

In order to improve the melt foaming properties of thermoplastic polyamide elastomers and reduce the shrinkage rate of foamed materials, acid anhydride chain extenders SMA (styrene maleic anhydride copolymer) are used in this paper to in situ reactive blending thermoplastic polyamide elastomers (TPAE) and polyamide 6 (PA6). The rheological and crystalline properties of the modified samples were characterized by a rotational rheometer and differential scanning calorimeter, and the melt batch foaming experiment with CO2 as the foaming agent was carried out. The results showed that the melting enthalpy of modified TPAE reduced with the addition of content of PA6, which implied that the crystallinity of the hard phase of the system was depressed. Nevertheless, the reduction of crystallinity was beneficial to improve the penetration of gas and reduce the effect of the pressure difference inside and outside the cell on foam shrinkage. Additionally, the microcross-linked structure formed with the increase of PA6 content enhanced the storage modulus of modified TPAE, which could accelerate recovery of strain. The foaming temperature zone and recovery performance of all modified TPAE samples were significantly improved. The overall shrinkage rate was reduced to less than 10%, the maximum expansion ratio could reach 11–13 times with a more complete and uniform cell structure, and the resilience was improved by about 12%.
1. Introduction
Polyamide elastomers (TPAE) are a class of block copolymers consisting of polyester amides (PEA), polyether ester amides (PEEA), polycarbonate ester amides (PCEA), and polyether block amides (PE-b-As). Hard segments are mainly based on aliphatic polyamides such as PA6, PA610, PA612, PA11, PA12, etc. Soft segments are based on aliphatic polyethers or polyesters such as polyethylene glycol (PEG), polypropylene glycol (PPG), and polytetrahydrofuran (PTMG).1,2 Both chain segments are linked by ester or amide groups. Its chemical structure and composition of two blocks determined their mechanical and thermal properties. The soft segments are usually above their glass transition temperature, which is good for the flexibility and ductility of the elastomer. Glassy or semicrystalline hard chain segments are used as physical cross-links to reduce chain slip and viscous flow of the copolymer.1,2 Different forms of microphase separation can occur between soft and hard segments due to their thermodynamic incompatibility.3,4 Compared to polyurethane elastomers (TPU), TPAE foams have been widely used in automotive parts, packaging materials, footwear, sports equipment, and medical applications due to their higher foam multiplicity, superior elasticity, flexibility, and wider temperature adaptability.5−7
As appeared in many thermoplastic elastomers, TPAE has a very significant shrinkage phenomenon during the physical foaming process. The pressure is quickly released to induce cell nucleation and growth during foaming. When the cell size becomes larger, both soft segments and the hard segments in the TPAE molecular chain were subjected to biaxial stretching force at this stage. Orientated soft segments would relax quickly after foaming, which would make the TPAE foaming expansion ratio decrease rapidly at the cooling stage. Meanwhile, hard segments, which were frozen, would be restored in the TPAE matrix contributing to permanent deformation at room temperature.8,9 As a result of the huge difference between CO2 and air permeability coefficients, CO2 permeates out of cells much faster than air permeates into them.10 So, there was a negative pressure to be formed. However, elastomer foams with higher expansion ratios usually have lower matrix modulus and cannot resist the pressure difference inside and outside the cell, which would further accelerate foam shrinkage.11 When air permeated into TPAE cells and reached an equilibrium state, the foam’s expansion ratio increased again. Then, the corresponding TPAE foams’ cell stabilization has been accomplished.12 The molecular chain will generate high tensile strain when the pressure release rate is high. If the strain is higher than the elastic limit, physical cross-linked hard domains will be destroyed and the elasticity of the molecular chain will decrease or even fail, resulting in permanent deformation of the foam.11,13
The shrinkage phenomenon will further bring about problems such as difficulty in weight reduction, poor dimensional stability, and reduction of mechanical properties. Therefore, the suppression of shrinkage of thermoplastic elastomer foams is of interest in scientific and industrial fields. Zhang et al.14 blended ABS and TPU with the assistance of diisopropyl peroxide (DCP) and maleic anhydride (MAH). They found that both strength of cell walls and stiffness of chains have improved owing to many grafting reactions that occurred in the blends, thus improving the cell morphology and reducing shrinkage of the blends. Sharudin and Ohshima15 used two SEBS copolymers with different styrene ratios (consisting of soft-segment ethylene-butylene (EB) and hard-segment polystyrene end blocks) as the elastomer base to blend with polystyrene (PS). With the addition of SEBS with higher styrene content or when PS reached 80/20 or 50/50, complex viscosity and storage modulus increased and the shrinkage of foam could be controlled, which led to the preparation of stable microcellular elastomer foam. Jiang et al.16 prepared long-chain branched (LCB) thermoplastic polyester elastomers by making linear thermoplastic polyester elastomers (TPEE) react orderly with branched chain modifier TGIC and chain extender 2,2’-BOZ. This structure had more branched structure and longer main chain, which made the sample possess higher viscosity, modulus, longer relaxation time, and stronger strain hardening effect, which could significantly improve the melt viscoelasticity and foaming ability. In summary, currently blending thermoplastic elastomers with other polymers or graft modification with chain extenders is one of the effective ways to reduce foam shrinkage.
This paper is aimed to solve the low expansion ratio, serious volume shrinkage, poor recovery, and cell collapse and rupture of TPAE foaming materials, which emerged as a result of low melt strength, storage modulus, low linear molecular chain stiffness, and low elasticity. Acid anhydride chain extenders SMA in situ reaction was used to increase the compatibility of TPAE and PA6. On the one hand, the reduction of melting enthalpy with the increase of PA6 content indicated that crystallinity of the hard phase in the system reduced, which was conducive to improve penetration of gas and reduce the effect of the pressure difference inside and outside the cell on foam shrinkage. On the other hand, microcross-linked structure formation increases the elasticity and strain recovery of TPAE with the addition of PA6. Also, a thermoplastic polyamide elastomer blended foam material with a high expansion ratio, high recovery, and low shrinkage rate was prepared by a supercritical foaming process.
2. Experimental Section
2.1. Materials and Sample Preparations
The TPAE with the grade of 4510 is provided by the China Risun Group; the density is 1.07 g/cm3; the hardness is 49D; and it is composed of a polyamide 6 hard segment and a polypropylene glycol soft segment with a content of 50%. The acid anhydride chain extender SMA is provided by Jiaxing Huawen Chemical Co., Ltd. It is a random copolymer of styrene and maleic anhydride; the glass transition temperature is 150 °C; and the molecular weight is 10 × 104–14 × 104. The CO2 used in this study was 99.0% pure and was developed by Beijing Shun’an Qite Gas Co., Ltd.
Polyamide elastomer (TPAE) and polyamide 6 (PA6) were dried in a DZF-6050 vacuum oven at 100 °C for 4 h, and SMA was dried at 80 °C for 4 h. The Rheomix 600 torque stream variable instrument was used to expand the chain. The reaction temperature is 225 °C; the speed is 60 rpm; and the response time is 10 min. First, the dry TPAE and PA6 melting were mixed together. After 1 min, the chain expansion agent SMA is added. The content of the chain expansion agent is 1%; the contents of polyamide 6 (PA6) are 5, 10, and 15%; and the corresponding contents of polyamide elastomer (TPAE) are 95, 90, and 85%, respectively. The obtained sample was pressed into a sheet with a radius of 1 cm and a thickness of 2 mm by a molding press.
2.2. Melt Batch Foaming
The polymer foams were prepared using the pressure-quench method on a batch foaming system. The sample was put into an autoclave with a temperature of 230 °C, and CO2 was injected to maintain the pressure in the autoclave at 12 MPa. Subsequently, the samples were saturated at the melting temperature for 30 min to ensure sample melting and gas saturation. After saturation, the autoclave temperature was cooled to the foaming temperature, and saturation was continued for 30 min to balance the diffusion and dissolution of CO2 in the sample. Then, the pressure in the autoclave was rapidly reduced to atmospheric pressure to prepare foamed samples.
2.3. Performance Testing and Structural Characterization
2.3.1. Fourier Transform Infrared Spectroscopy
TPAE and its modified samples were separately ground with KBr powder at a ratio of 1:100, pressed into films measuring 5 cm long and 3 cm wide, and analyzed using a Fourier transform infrared (FTIR) spectrometer (Nicolet 6700) within the range of 400–4000 cm–1 at a resolution of 4.0 cm–1. The samples and backgrounds were both scanned 16 times.
2.3.2. Crystallization Properties
A 5–8 mg sample was taken and tested with a differential scanning calorimeter (DSC, Q2000, TA Instruments). (i) It was rapidly heated up to 250 °C for 1 min to eliminate the thermal history, (ii) cooled down to room temperature at a rate of 10 °C/min while recording the crystallization curve, and (3) heated up to 250 °C at a rate of 10 °C/min while recording the melting curve. The parameters related to the crystallization process were obtained from the first cooling curve, including the initial crystallization temperature Ton and the crystallization peak temperature TC. The parameters of crystal melting, including melting temperature Tm and melting enthalpy ΔHm, were obtained from the second heating curve. Through these parameters, the semicrystallization time t1/2 can be obtained, and the calculation equation is
| 1 |
where X is the cooling rate (°C/min).17
2.3.3. Rheological Characterization
The dynamic frequency sweep test was carried out on the sample by the HAAKE plate rotational rheometer. To ensure the tests within the linear viscoelastic region, all the measurements were carried out with a strain amplitude of 0.01 and the frequency ranging from 100 to 0.1 rad/s; the test temperature was 225 °C. For changes of viscoelastic performance parameters such as storage modulus (G′), loss modulus (G″), and complex viscosity (|η*|) with frequency, in order to prevent oxidative degradation, the tests were carried out in a nitrogen environment of 0.2 MPa.
2.3.4. Dynamic Mechanical Thermal Analysis
The samples were subjected to dynamic mechanical thermal analysis in torsional mode using a HAAKE MARS torsional rheometer, and the dynamic mechanical properties of TPAE and its modified samples were measured in the range of 25–200 °C. Samples were trimmed to 20 mm long and 10 mm wide with a thickness of 1 mm and were clamped by solid clamping tools. A constant oscillatory deformation of 0.01% was applied at a constant frequency of 1 Hz. During the test, the axial force was kept at 0.5 N, and all tests were carried out at a heating rate of 4 °C/min.
2.3.5. Foaming Property
The expansion ratios (φ) of the foamed samples were calculated as follows,
| 2 |
where ρ1 (1.07 g/cm3) is the density of the unfoamed sample and ρ2 (g/cm3) is the density of the foamed sample. We used a drainage method to test ρ2 according to the ASTM D792-00 standard.
The foamed samples were cut into slender strips with a width of about 2 mm, soaked in liquid nitrogen for brittle fracture, sprayed with gold on the section, and placed in an electron scanning microscope room, and the cell structure of the brittle section was photographed. The cell morphology of the brittle fracture surface of the foamed samples can be obtained.
The shrinkage rate Qi represents the change of the degree of shrinkage of the foamed sample with time. The calculation formula 3 is as follows:φ1is the initial expansion ratio of the sample, and φi is the expansion ratio of the sample changing with time.
| 3 |
2.3.6. Instantaneous Resilience Property Analysis
A drop ball resilience equipment (PMLQ-500) was used to evaluate the rebounding performance. The fully recovered foam samples were tested under the same experimental conditions to illustrate the resilience of each sample. In a standard drop-ball rebound resilience test, a steel ball with a diameter of 16 mm was fallen from a fixed distance of 500 mm down to the surface of the test specimen, and then the maximum rebound height was recorded. The percentage rebound coefficient, R, was calculated by dividing the measured rebound height with the initial height, and then it was used to quantitatively assess the rebounding performance. To make sure of the accuracy of the results, the resilience testing was repeated 3 times for each sample.
3. Results and Discussion
3.1. Reaction Process and Mechanism
Torque of the mixer reaction is proportional to the viscosity of material, which depends on the molecular weight and chain structure of the polymer. Figure 1 shows the torque curve with time during the compounding process. After TPAE and PA6 were added to the torque rheometer, the melt temperature increased and torque gradually decreased due to shear heat. The torque increased, and its peak appeared after adding chain extender SMA, which proved that both TPAE and PA6 could have a chain extension reaction with SMA. Also, reaction rate of TPAE was faster than that of PA6. It could be found that the peak area, slope of torque-time curve, and the torque during stabilization all increased with the increase of PA6 when different contents of PA6 was added into the TPAE and SMA system. It shows that TPAE, PA6, and SMA undergo a viscosity increasing reaction, and the addition of PA6 can further increase the molecular weight and the degree of molecular chain branching.18
Figure 1.

Torque as a function of processing time.
SMA is a random copolymer of styrene and maleic anhydride produced by bulk polymerization. Not only does it have good compatibility with many polymers such as ABS, styrene acrylonitrile, and polycarbonate but it also reduces polyamide crystallinity and increases its melt strength.19Figure 2 is the infrared spectrum of SMA, TPAE, and their composites. The characteristic spectral bands of SMA at 1778 and 1856 cm–1 are the stretching vibration absorption peaks of carbonyl (C=O) in the acid anhydride group,20,21 while these spectral bands do not appear in composites, which implies that SMA reacts with the hard segment of PA6 in TPAE through the anhydride group. In addition, the peaks at 3290–3300 cm–1 in TPAE and its chain-extended blends correspond to the N–H stretching vibrations, while the sharp peaks at 1638 and 1543 cm–1 separately correspond to the C=O stretching vibrations (amide I) and CO–N–H bending vibration (amide II) induced.22−24 It can be observed that the N–H stretching vibration intensity and the peak area decreases, while the C=O stretching vibration (amide I) and CO–N–H bending vibration (amide II) intensity and peak area increase in the modified TPAE compared with raw material, which further illustrates that anhydride groups in SMA can react with amino groups in TPAE.
Figure 2.

FT-IR spectra of TPAE and chain-extended blend samples.
As shown in Figure 3, the hard segment of TPAE is PA6 and the amino group at the end of polyamide can easily undergo a ring-opening reaction with the acid anhydride group in SMA, which will form an amide at one end and a carboxyl group at the other end. The carboxyl group generated by the reaction and the carboxyl group in PA6 can continue to react with the amino group to form a branched structure. Schacker et al.25 also obtained a similar graft structure by using PA6 and SMA. With the increasing content of PA6, these branched structures may realize chain connection and then form a network cross-linked structure as shown in Figure 4.
Figure 3.

Chain extension blending reaction process diagram.
Figure 4.

Schematic diagram of the network cross-linked structure.
3.2. Rheological Properties
Rheological properties play a key role in the foaming process. Moderate viscosity, good elasticity, and high melt strength are required for polymers with good melt foamability. Figure 5 shows the curve of complex viscosity with angular frequency. The complex viscosity increases, and the degree of shear thinning is not obvious after the reaction of PA6 and SMA, which can be agitated by the molecular weight increases, but the degree of branching is not high. Although the complex viscosity in the low frequency region does not increase much after the reaction of TPAE and SMA, there is an obvious shearing thinning phenomenon, implying the formation of branched structures. When TPAE, PA6, and SMA were reacted at the same time, complex viscosity and the degree of shear thinning increased with the addition of PA6 content. It demonstrates that the TPAE molecular chain has a wider relaxation time distribution and longer maximum relaxation time after chain extension blending. At the same time, the molecular weight, degree of branching, entanglement of molecular chains, and melt viscosity also increase.26
Figure 5.

Complex viscosity vs angle frequency.
Storage modulus is an important parameter to characterize the elasticity of polymer melts, and its trend with angular frequency can reflect the degree of molecular chain branching. Figure 6 exhibits the variation of storage modulus with angular frequency. The storage modulus of samples increases significantly and tends to the same value at high frequency after chain extension and blending, but there is a big difference at low frequency. The storage modulus at high frequency is mainly affected by molecular weight distribution, while it is influenced by molecular topology at low frequency.27 According to the Chambon Winter criterion,28 polymer melt satisfies the following relation during a dynamic frequency sweep,
| 4 |
Figure 6.

Storage modulus vs angle frequency.
where n is the network relaxation index. The smaller the value of n, the higher the branching degree of the molecular chain.29 It can also be seen from Figure 6 that the slopes at the low-frequency end of the storage modulus of PA6 and PA6/SMA samples are higher, while the slopes at the low-frequency end of the storage modulus of TPAE/SMA and TPAE/PA6/SMA samples decrease in turn. It can be suggestive of the fact that the TPAE samples modified with both PA6 and SMA have a more tightly entangled network structure and a longer relaxation process.
The loss tangent (tanδ) is the ratio of loss modulus and storage modulus. It is used to evaluate the proportion of elastic properties in viscoelasticity of polymers. Park and Malone30 studied the foaming coefficient of polypropylene foam, which satisfied the relationship of F = ρfD(tanδ)0.75 ≤ 1.8, where ρf is the foam density and D is the average cell diameter. This formula qualitatively shows the law that foaming performance is negatively correlated with tanδ. Figure 7 shows the curve of tanδ with angular frequency. In the whole frequency range, tanδ curves of TPAE, TPAE/SMA, and TPAE/PA6/SMA shift downward in turn and viscoelasticity increases sequentially. When the PA6 content exceeds 15%, tanδ is less than 1, which represents that G′ is bigger than G″. The appearance indicates that elastic properties are dominant in viscoelasticity. The improvement of viscoelasticity can maintain the growth and stability of the foam and avoid the collapse of the foam during the foaming process.
Figure 7.

tanδ vs angle frequency.
Figure 8 is a vGP plot, representing the relationship between complex modulus |G*| and loss angle δ. The shape of the vGP curve is not influenced by factors such as polymer type and test temperature but by the distribution of polymer molecular mass and the presence of long branched structures in the molecular chain. The widening of molecular mass will only make the curve shift downward or flatten and also not change the shape of the curve. The long branched chain structure will lead to a change in the shape of the curve and an inflection point.31 As shown in Figure 8, the vGP curve of TPAE and PA6 are an obvious convex curve and the loss angle gradually increases with the reduction of complex modulus. Finally, it reaches a plateau value of 90°, which is a typical curve characteristic of linear polymers. After adding the chain extender SMA, the vGP curve of TPAE/SMA shifts downward and tends to be flat, but the shape of the curve does not change. Therefore, adding chain extender SMA alone will broaden the molecular weight of TPAE but not produce an obvious branching structure. While the chain extenders SMA and PA6 were added at the same time, the vGP curve of TPAE/PA6/SMA shifted significantly downward and the curve shows an obvious downward inflection point, which show that there is a significant branched structure that appeared.
Figure 8.

vGP curve.
Figure 9 is a Cole–Cole diagram, which can reflect the relationship between the imaginary part η″ and the real part η′ of complex viscosity. The Cole–Cole diagram of a linear molecular chain is close to a semicircle. The diameter of semicircles has a positive correlation with molecular weight. If there is a branched chain structure, the curve will deviate from the semicircular shape and the end will rise.29 As shown in Figure 9, the curve of TPAE and PA6 is a standard semicircle shape, so it has linear molecular chain. After adding the chain extender SMA, the curve radius of PA6/SMA and TPAE/SMA increases, while the phenomenon of end upturning is not obvious, indicating that its molecular weight increases but the degree of branching is low. After adding SMA and PA6 at the same time, the radius of the curve increases and the end upturning phenomenon is more obvious with the increase of PA6 content, exhibiting that the TPAE after chain extension and blending has a higher degree of branch chain.
Figure 9.
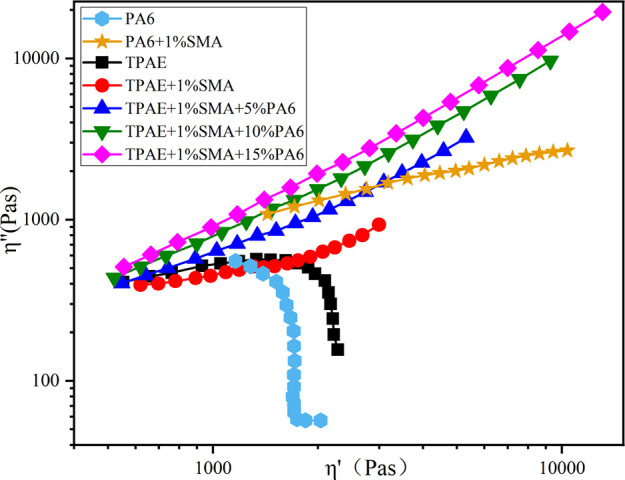
Cole–Cole curve.
3.3. Crystallization and Melting Behaviors
Figures 10 and 11 are the crystallization curves of TPAE and its chain-extended blend samples during the first cooling process and the crystal melting curves during the second heating process. The specific crystal melting parameters are shown in Table 1. As can be seen from the graph, TPAE, PA6, and SMA have good compatibility and the melt curve only has one melt peak. When the chain extender SMA is added alone, the crystallization temperature TC, the initial crystallization temperature Ton, and the melting enthalpy ΔHm all decrease and the semicrystallization time t1/2 extends, indicating that the crystallization performance decreases. The result is that the chain extension reaction increased the molecular weight of TPAE and the degree of molecular chain branching made the rearrangement movement of macromolecules and segment crystallization difficult, which will inhibit the crystallization process. When the chain extenders SMA and PA6 are added at the same time, the crystallization temperature TC and the initial crystallization temperature Ton increase significantly. It is mainly because the −NH2 in PA6 provides TPAE with higher hydrogen bond density and stronger intermolecular force, which will promote crystallization of hard segment.22 However, a long-chain branched or microcross-linked structure will be formed due to the simultaneous chain extension reaction of TPAE/SMA/PA6 blending, which can reduce the mobility of macromolecular chains.32 It can also be seen from the melting curve in Figure 11 that the melting point has increased and the melting peak is significantly broadened, showing that PA6 promotes nucleation and forms a more compact and regular crystalline structure. In the meantime, long branched or microcross-linked structure hinders the crystal growth and leads the formation of an imperfect crystalline structure. Both the crystallinity of the polymer and the morphology of the crystals (such as the ratio of crystal width to thickness) will reduce the gas permeability and improve the barrier property of polymer.33−35 Therefore, the reduced crystallinity of the modified TPAE may be more conducive to the volume recovery of the foam after shrinkage.
Figure 10.

Crystallization curve.
Figure 11.

Melting curve.
Table 1. Crystal Melting Parameter Table.
| samples | ΔHm(J/g) | TC (°C) | Ton (°C) | Tm (°C) | t1/2 (min) |
|---|---|---|---|---|---|
| PA6 | 59.96 | 168.67 | 187.24 | 221.71 | 1.857 |
| TPAE | 27.86 | 152.06 | 155.84 | 207.73 | 0.378 |
| TPAE + 1%SMA | 27.65 | 151.40 | 155.37 | 207.42 | 0.397 |
| TPAE + 1%SMA + 5%PA6 | 27.22 | 165.66 | 170.02 | 208.87 | 0.436 |
| TPAE + 1%SMA + 10%PA6 | 26.03 | 168.37 | 173.08 | 209.60 | 0.471 |
| TPAE + 1%SMA + 15%PA6 | 24.32 | 170.18 | 175.30 | 209.75 | 0.512 |
3.4. Dynamic Mechanical Thermal Analysis (DMTA)
The application of dynamic mechanical thermal analysis can determine the viscoelastic characteristic parameters of polymer materials, such as storage modulus, loss modulus, mechanical damping, etc. It can also provide much information about molecular chain structure and interface.36,37 Storage modulus (G′) is an important indicator to measure the rigidity and elastic properties of polymer materials.38Figure 12 shows the storage modulus (G′) of TPAE and its modified samples as a function of temperature. It can be clearly seen that the storage modulus (G′) of all samples decreases with the increase of temperature, which is because polymer chains can move more easily at high temperature.39 From room temperature to the glass transition temperature of the hard segment, the soft segment is in a highly elastic state, while the hard segment is in a glassy state. The glass transition temperature of the hard segment appears at around 100 °C. After the glass transition temperature, the hard segment also becomes a highly elastic state. TPAE begins to transform into a viscous flow, and the material enters a viscous flow state with a significant drop in storage modulus at around 175 °C. The modified TPAE forms long-chain branched or microcross-linked structures, which improves the rigidity and entanglement of molecular chains and increases the viscous flow transition temperature.40 The storage modulus (G′) of modified TPAE is higher than that of pure TPAE at any temperature, and the value of storage modulus (G′) is higher with the increasing content of PA6, which is consistent with the rheological properties. It can be shown that the TPAE material greatly improves the rigidity and elasticity of the material after chain extension and blending due to the formation of a long-chain branched or microcross-linked structure. When deformed by force, it can resist and recover better, which may be beneficial for the recovery of foam materials after shrinkage.
Figure 12.

Storage modulus (G′) obtained by DMA as a function of temperature.
3.5. Foaming Properties
TPAE and its modified sample foams were prepared by using the pressure-quench method in a batch foaming system. As shown in Table 2, the optimal foaming temperature of different samples is different. The foaming temperature of the samples added with SMA and PA6 increases, while the initial foaming ratio decreases. It can be seen from the crystallization properties that the crystallization and melting temperature of modified TPAE are greatly improved compared with TPAE, resulting in a great change in the foaming temperature zone. Furthermore, long-chain branched or microcross-linked structure and high melt viscoelasticity can affect the foaming temperature and expansion ratio.41
Table 2. Intermittent Foaming Process Condition Table.
| samples | pressure(MPa) | melting temperature (°C) | foaming temperature (°C) | initial expansion ratio |
|---|---|---|---|---|
| TPAE | 12 | 230 | 180 | 16.21 |
| TPAE + 1%SMA | 12 | 230 | 205 | 12.15 |
| TPAE + 1%SMA + 5%PA6 | 12 | 230 | 215 | 12.39 |
| TPAE + 1%SMA + 10%PA6 | 12 | 230 | 220 | 13.63 |
| TPAE + 1%SMA + 15%PA6 | 12 | 230 | 220 | 13.72 |
Generally speaking, increasing the initial expansion ratio will exacerbate the shrinkage of elastomer foam.11 In order to evaluate the dimensional stability of TPAE foaming samples, the change of the foaming samples’ expansion ratio with time within 24 h was recorded and the shrinkage rate and recovery rate were defined. The shrinkage rate is the ratio of the shrinkage of the foaming sample to the initial expansion rate, while the recovery ratio is the expansion ratio recovered by the foamed sample to the expansion ratio after stabilization.
As shown in Figure 13, the initial surface of each foaming sample is smooth without wrinkles and full in shape. After about 20 min, the foam reaches the maximum shrinkage state, the foam obviously shrinks and deforms, and the volume decreases. One week later, the recovery of foam is completed. It can be seen that the recovery degree of pure TPAE is low, and the volume is almost the same as that of full shrinkage. On the contrary, the recovery degree of modified TPAE is higher, and the recovery is larger than that of full shrinkage. As shown in Figures 14 and 16, the initial expansion ratio of TPAE could reach 16.21 times, but it rapidly shrank to 5.17 times after 5 min with a shrinkage rate as high as 68.1%. After adding chain extenders SMA and PA6, the shrinkage rate decreased and the shrinkage of samples with 15% PA6 addition dropped to about 50%. The TPAE foam entered a recovery phase after complete shrinkage. Figure 15 shows variation of recovery rate with time within 24 h. The recovery performance of TPAE foam is poor with a recovery rate of 28%. The recovery rate of the TPAE + SMA foam sample improved, but its recovery degree is still poor. Interestingly, the foam recovery rate increased to more than 45% with the increasing content of PA6 for the TPAE sample modified by SMA + PA6. After recovery, the expansion ratio reached 11–12 times and the shrinkage rate dropped to below 10%. Finally, the foam could be completely recovered.
Figure 13.

Apparent morphology of each sample in different states.
Figure 14.

Variation curve of the expansion ratio with time.
Figure 16.

Comparison of the expansion ratio and shrinkage ratio of different samples.
Figure 15.

Variation of the recovery rate with time.
The reasons for the above results may be as below. First, the pressure difference inside and outside of cells is the main reason for the shrinkage of TPAE foam. The blowing agent quickly escapes from the cell after foaming, while the air diffusion rate in the environment is slow, resulting in a higher ambient pressure than the pressure inside the cells. Due to the low melt strength and low elastic modulus of TPAE, it cannot resist the pressure difference inside and outside the cell, resulting in serious volume shrinkage.11 Second, the molecular chain orientation on the cell wall caused by cell growth will recover elastically, which will also cause the foam to shrink. It can be seen from Figure 16 that the addition of SMA and PA6 reduces the shrinkage rate of TPAE foam and the shrinkage rate gradually decreases with the increase of PA6 content. The performance is related to the increase of the high elastic storage modulus of modified TPAE, as can be seen in Figure 12. The microcross-linked structure formed by PA6, SMA, and TPAE increases the modulus of the modified TPAE and improves the resistance to the pressure difference inside and outside the cell deformation, leading to the shrinkage rate decreases.
After foam shrinkage, as the air diffuses into the inside of the cell, the pressure difference between the inside and outside decreases. The foam volume will gradually increase, and the phenomenon of recovering the expansion rate occurs. It can be seen from Figures 14 and 15 that the pure TPAE foam has a longer recovery time and a lower recovery rate, while the SMA chain-extended modified TPAE has a faster recovery rate, and the recovery ratio is also higher than that of pure TPAE. The TPAE foam after adding PA6 and SMA has a higher recovery rate. The recovery of the expansion ratio during foam aging is related to the diffusion rate of air into the cells. The greater the diffusion rate, the faster the pressure different between the inside and outside of the cells reached, and the greater the recovery rate. Meanwhile, the strain recovery of the elastomer is also related to the degree of microcross-linking. The chemical microcross-linking or hard phase microcrystals in TPAE are similar to the physical cross-linking points, which are beneficial to elastic strain recovery.13,42 The more microcross-linking, the better the elasticity of the material, which is more conducive to strain recovery. As shown in Table 1, the difference in in melting enthalpy between TPAE + SMA and TPAE is intensely small, indicating that the diffusion rate of air in the two samples differs very little. The difference in the recovery rate is mainly due to the microcross-linked structure formed in SMA chain-extended modified TPAE, which increases the elasticity of the material. The reason for the low recovery rate of pure TPAE is that the hard phase microdomain was destroyed and the physical entanglement and interaction between macromolecular chains were weakened under large deformation in the process of cell growth. On the contrary, TPAE modified by SMA chain extension forms long-chain branches or chemical microcross-links, which enhances the entanglement between macromolecules and has a higher recovery rate under large deformation. For TPAE modified by PA6 + SMA, the melting enthalpy of modified TPAE decreased with the increase of PA6 content, implying that the crystallinity of the hard phase of the system was reduced. The reduction of crystallinity was conducive to improving the penetration of gas and reducing the effect of the pressure difference inside and outside the cell. On the other hand, the microcross-linked structure formed with the increase of PA6 content increased the elasticity of modified TPAE, which could accelerate the recovery of strain. The combined results of the two improved the recovery rate of PA-modified TPAE foam.
Figure 17 shows the structure of the TPAE cell prepared at different processing temperatures. The foaming temperature of pure TPAE is low, and the foaming temperature zone is narrow. With the increase of temperature, the cell shape of pure TPAE is irregular and there are phenomena such as merging, rupture, and unevenness. Due to the low melt strength of TPAE, the cell wall ruptures under the tensile action of foaming, resulting in the merging of cells and a decrease in the expansion ratio. The foaming temperature of modified TPAE increased, and the foaming temperature zone widened. The cells of the modified TPAE changed from irregular shapes to polygons, and the cells did not merge and burst and were very uniform. The reason was that the modified TPAE had a higher degree of branching, which increased the yield strain and melt strength,43,44 so that the cell wall could withstand tensile strain and deform uniformly during the cell expansion process, resulting in a more uniform and complete cell structure at different temperatures.
Figure 17.

Cell structure of different samples.
3.6. Instantaneous Resilience Property Analysis
In order to characterize the potential application of TPAE foams on the super-elastic sneakers, the instantaneous resilience of foams is investigated by the drop ball resilience tests. Figure 18 shows the rebound performance of different foam samples after full recovery. It can be seen from the figure that the rebound rate of pure TPAE foam material after full recovery is 46.178%, and after adding chain extender SMA, the rebound rate increases to 52.300%. With the increase of PA6, the rebound rate continues to increase. At 10% PA6, the highest rebound rate is 58.168%. First, the analysis may be due to the fact that the modified TPAE foam has better recovery properties and a more uniform and complete pore structure after shrinkage, which gives the foam better resilience properties. Second, as shown in Figure 12, the storage modulus of the modified TPAE is increased after PA6 is added, which improves the resilience of the material. However, the resilience of foam decreases when 15% PA6 is added. This is because foam with higher storage modulus has a thicker cell wall and has significant deformation resistance at the moment of impact of the falling ball, which means that the falling ball under the same potential energy reduces the deformation of foam, thus reducing the resilience of foam.45,46 Therefore, the improvement of the resilience of the modified TPAE is based on the appropriate storage modulus of the material.
Figure 18.

Resilience of different foamed samples after complete recovery.
4. Conclusions
In conclusion, we have developed a method to effectively reduce the shrinkage of thermoplastic polyamide elastomer foam. Thermoplastic polyamide elastomer (TPAE) and polyamide 6 (PA6) were modified by chain extension blending under the action of anhydride chain extender (SMA). The foaming temperature zone of the modified TPAE is significantly widened; the recovery performance is significantly improved; the overall shrinkage rate is reduced to less than 10%; the maximum expansion ratio can reach 11–13 times; the cell structure is more uniform and complete; and the resilience was improved by about 12%. There are two main reasons for the above results: first, for TPAE modified by PA6 + SMA, the melting enthalpy of modified TPAE decreased with the increase of PA6 content, implying that the crystallinity of the hard phase of the system was reduced. The reduction of crystallinity was conducive to improving the penetration of gas and reducing the effect of negative pressure on foam shrinkage. On the other hand, the microcross-linked structure formed with the increase of PA6 content increased the elasticity of modified TPAE, which could accelerate the recovery of strain. The combined results of the two improved the recovery rate of PA-modified TPAE foam.
The authors declare no competing financial interest.
References
- Nelb R.; Chen A. Thermoplastic elastomers based on polyamides. Thermoplastic Elastomers: A Comprehensive Review. 1996, 228–255. [Google Scholar]
- Drobny; George J.. Handbook of Thermoplastic Elastomers.2007, 191–199, 10.1016/B978-081551549-4.50008-6. [DOI] [Google Scholar]
- Yoon P. J.; Han C. D. Effect of thermal history on the rheological behavior of thermoplastic polyurethanes. Macromolecules 1993, 33, 2171–2183. 10.1021/ma00064a030. [DOI] [Google Scholar]
- Nichetti D.; Grizzuti N. Determination of the phase transition behavior of thermoplastic polyurethanes from coupled rheology/DSC measurements. Polym. Eng. Sci. 2004, 44, 1514–1521. 10.1002/pen. [DOI] [Google Scholar]
- Wang G.; Zhao G.; Dong G.; Mu Y.; Park C. B.; Wang G. Lightweight, super-elastic, and thermal-sound insulation bio-based PEBA foams fabricated by high-pressure foam injection molding with mold-opening. Eur. Polym. J. 2018, 68–79. 10.1016/j.eurpolymj.2018.04.002. [DOI] [Google Scholar]
- Murray K. A.; Kennedy J. E.; Mcevoy B.; Vrain O.; Ryan D.; Cowman R.; Higginbotham C. L. Effects of temperature, packaging and electron beam irradiation processing conditions on the property behaviour of Poly (ether-block-amide) blends. Mater. Sci. Eng., C 2014, 39, 380–394. 10.1016/j.msec.2014.03.021. [DOI] [PubMed] [Google Scholar]
- Barzegari M. R.; Hossieny N.; Jahani D.; Park C. B. Characterization of hard-segment crystalline phase of poly (ether-block-amide)(PEBAX®) thermoplastic elastomers in the presence of supercritical CO2 and its impact on foams. Polymer 2017, 114, 15–27. 10.1016/j.polymer.2017.02.088. [DOI] [Google Scholar]
- Voda A.; Voda M. A.; Beck K.; Schauber T.; Adler M.; Dabisch T.; Bescher M.; Viol M.; Dan E. D.; Blümich B. Segmental orientation of thermoplastic polyurethanes investigated by 1 H double-quantum NMR. Correlation with thermodynamic and mechanical properties. Polymer 2006, 47, 2069–2079. 10.1016/j.polymer.2006.01.023. [DOI] [Google Scholar]
- Lin S. B.; Hwang K. S.; Tsay S. Y.; Cooper S. L. Segmental orientation studies of polyether polyurethane block copolymers with different hard segment lengths and distributions. Colloid Polym. Sci. 1985, 263, 128–140. 10.1007/BF01412787. [DOI] [Google Scholar]
- Zhang H.; Liu T.; Li B.; Li H.; Cao Z.; Jin G.; Zhao L.; Xin Z. Foaming and dimensional stability of LDPE foams with N2, CO2, i-C4H10 and CO2-N2 mixtures as blowing agents. J. Supercrit. Fluids 2020, 164, 104930 10.1016/j.supflu.2020.104930. [DOI] [Google Scholar]
- Zhai W.; Jiang J.; Park C. B. A review on physical foaming of thermoplastic and vulcanized elastomers. Polym. Rev. 2022, 62, 95–141. 10.1080/15583724.2021.1897996. [DOI] [Google Scholar]
- Li R.; Lee J. H.; Wang C.; Lun H. M.; Park C. B. Solubility and diffusivity of CO2 and N2 in TPU and their effects on cell nucleation in batch foaming. J. Supercrit. Fluids 2019, 154, 104623 10.1016/j.supflu.2019.104623. [DOI] [Google Scholar]
- Lan B.; Li P.; Yang Q.; Gong P. Dynamic self generation of hydrogen bonding and relaxation of polymer chain segment in stabilizing thermoplastic polyurethane microcellular foams. Mater. Today Commun. 2020, 24, 101056 10.1016/j.mtcomm.2020.101056. [DOI] [Google Scholar]
- Zhang R.; Huang K.; Hu S.; Liu Q.; Zhao X.; Liu Y. Improved cell morphology and reduced shrinkage ratio of ETPU beads by reactive blending. Polym. Test. 2017, 63, 38–46. 10.1016/j.polymertesting.2017.08.007. [DOI] [Google Scholar]
- Sharudin R. W. B.; Ohshima M. Preparation of microcellular thermoplastic elastomer foams from polystyrene-b-ethylene-butylene-b-polystyrene (SEBS) and their blends with polystyrene. J. Appl. Polym. Sci. 2013, 128, 2245–2254. 10.1002/app.38104. [DOI] [Google Scholar]
- Jiang R.; Chen Y.; Yao S.; Liu T.; Xu Z.; Park C. B.; Zhao L. Preparation and characterization of high melt strength thermoplastic polyester elastomer with different topological structure using a two-step functional group reaction. Polymer 2019, 179, 121628 10.1016/j.polymer.2019.121628. [DOI] [Google Scholar]
- Aoyama S.; Park Y. T.; Ougizawa T.; Macosko C. W. Melt crystallization of poly (ethylene terephthalate): Comparing addition of graphene vs. carbon nanotubes. Polymer 2014, 55, 2077–2085. 10.1016/j.polymer.2014.02.055. [DOI] [Google Scholar]
- Xu M.; Yan H.; He Q.; Wan C.; Liu T.; Zhao L.; Park C. B. Chain extension of polyamide 6 using multifunctional chain extenders and reactive extrusion for melt foaming. Eur. Polym. J. 2017, 96, 210–220. 10.1016/j.eurpolymj.2017.09.012. [DOI] [Google Scholar]
- Lin Y.; Zhong W.; Shen L.; Xu P.; Du Q. Study on the Relationship Between Crystalline Structures and Physical Properties of Polyamide-6. J. Macromol. Sci., Part B: Phys. 2005, 44, 161–175. 10.1081/MB-200049762. [DOI] [Google Scholar]
- Xu Y.; Zhao C.; Guo Z.; Dong W.; Liu X.; Guo W. EPDM-g-MAH toughened bio-based polyamide 56 to prepare thermoplastic polyamide elastomer and the performance characterization. J. Appl. Polym. Sci. 2022, 139, 52346. 10.1002/app.52346. [DOI] [Google Scholar]
- Wang S.; Li B.; Zhang Y. Compatibilization of poly (2, 6-dimethyl-1, 4-phenylene oxide)/polyamide 6 blends with styrene–maleic anhydride copolymer: Mechanical properties, morphology, crystallization, and melting behavior. J. Appl. Polym. Sci. 2010, 118, 3545–3551. 10.1002/app.32730. [DOI] [Google Scholar]
- Tong X.; Peng W. M.; Zhang M. L.; Wang X. J.; Zhang G.; Long S. R.; Yang J. A new class of poly (ether-block-amide) s based on semi-aromatic polyamide: synthesis, characterization and structure–property relations. Polym. Int. 2021, 70, 230–241. 10.1002/pi.6119. [DOI] [Google Scholar]
- Jiang J.; Tang Q.; Pan X.; Xi Z.; Zhao L.; Yuan W. Structure and morphology of thermoplastic polyamide elastomer based on long-chain polyamide 1212 and renewable poly (trimethylene glycol). Ind. Eng. Chem. Res. 2020, 59, 17502–17512. 10.1021/acs.iecr.0c01334. [DOI] [Google Scholar]
- Yuan R.; Wang X.; Yu J.; Wu D.; Li F. Phase Evolution of Polyamide 6 (PA6)-Based Thermoplastic Elastomers during Heating and Cooling Investigated by Moving-Window 2D Correlation Infrared Spectroscopy. Macromol. Mater. Eng. 2020, 305, 2000440 10.1002/mame.202000440. [DOI] [Google Scholar]
- Schacker O.; Braun D.; Hellmann G. P. Chain extension of oligoamide or polyamide in an extruder. Macromol. Mater. Eng. 2001, 286, 382–387. 10.1002/1439-2054(20010701)286:73.0.CO;2-7. [DOI] [Google Scholar]
- Nam G.; Yoo J.; Lee J. Effect of long-chain branches of polypropylene on rheological properties and foam-extrusion performances. J. Appl. Polym. Sci. 2005, 96, 1793–1800. 10.1002/app.21619. [DOI] [Google Scholar]
- Han C. D.; Jhon M. S. Correlations of the first normal stress difference with shear stress and of the storage modulus with loss modulus for homopolymers. J. Appl. Polym. Sci. 1986, 32, 3809–3840. 10.1002/app.1986.070320302. [DOI] [Google Scholar]
- Yamaguchi M.; Miyata H. Strain hardening behavior in elongational viscosity for binary blends of linear polymer and crosslinked polymer. Polym. J. 2000, 32, 164–170. 10.1295/polymj.32.164. [DOI] [Google Scholar]
- Tian J.; Yu W.; Zhou C. The preparation and rheology characterization of long chain branching polypropylene. Polymer 2006, 47, 7962–7969. 10.1016/j.polymer.2006.09.042. [DOI] [Google Scholar]
- Park C. P.; Malone B. A.. Extruded closed-cell polypropylene foam. U.S. Patent 5, 527,573, 1996.
- Trinkle S.; Walter P.; Van Friedrich C. Gurp-Palmen plot II–classification of long chain branched polymers by their topology. Rheol. Acta 2002, 41, 103–113. 10.1007/s003970200010. [DOI] [Google Scholar]
- Lee Y. H.; Lee C. W.; Chou C. H.; Lin C. H.; Chen Y. H.; Chen C. W.; Way T. F.; Rwei S. P. Sustainable polyamide elastomers from a bio-based dimer diamine for fabricating highly expanded and facilely recyclable microcellular foams via supercritical CO2 foaming. Eur. Polym. J. 2021, 160, 110765 10.1016/j.eurpolymj.2021.110765. [DOI] [Google Scholar]
- Ando S.; Sato S.; Nagai K. Gas Permeation and Barrier Properties of Liquid Crystalline Polymers. Liq. Cryst. Polym. 2020, 1–25. 10.1007/978-3-030-43350-5_67. [DOI] [Google Scholar]
- Drieskens M.; Peeters R.; Mullens J.; Franco D.; Lemstra P. J.; Hristova-Bogaerds D. G. Structure versus properties relationship of poly (lactic acid). I. Effect of crystallinity on barrier properties. J. Polym. Sci., Part B: Polym. Phys. 2009, 47, 2247–2258. 10.1002/polb.21822. [DOI] [Google Scholar]
- Sawada H.; Takahashi Y.; Miyata S.; Kanehashi S.; Sato S.; Nagai K. Gas transport properties and crystalline structures of poly (lactic acid) membranes. Trans. Mater. Res. Soc. Jpn 2010, 35, 241–246. 10.14723/tmrsj.35.241. [DOI] [Google Scholar]
- Zhang R. X.; Ni Q. Q.; Natsuki T.; Iwamoto M. Mechanical properties of composites filled with SMA particles and short fibers. Compos. Struct. 2007, 79, 90–96. 10.1016/j.compstruct.2005.11.032. [DOI] [Google Scholar]
- Kolařík J.; Fambri L.; Šlouf M.; Konečný D. Heterogeneous polyamide 66/syndiotactic polystyrene blends: Phase structure and thermal and mechanical properties. J. Appl. Polym. Sci. 2005, 96, 673–684. 10.1002/app.21496. [DOI] [Google Scholar]
- Liang J. Z. Storage modulus and characterization of inorganic particle-filled polymer composites. J. South China Univ. Technol. 2008, 36, 143–146. [Google Scholar]
- Gnatowski A.; Koszkul J. Investigation on PA/PP mixture properties by means of DMTA method. J. Mater. Process. Technol. 2006, 175, 212–217. 10.1016/j.jmatprotec.2005.04.020. [DOI] [Google Scholar]
- Deng Y. E.; Zhang W. G. Testing and Analysis of Dynamic Viscoelasticity of Polymers with DMTA(IV). Shaoguan University, Experimental Center of the School of Information; Fujian Normal University, School of Materials Chemistry 2005, 24, 27–28. [Google Scholar]
- Xu M.; Chen Y.; Liu T.; Zhao L.; Park C. B. Determination of modified polyamide 6’s foaming windows by bubble growth simulations based on rheological measurements. J. Appl. Polym. Sci. 2019, 136, 48138. 10.1002/app.48138. [DOI] [Google Scholar]
- Xu Z.; Wang G.; Zhao J.; Zhang A.; Dong G.; Zhao G. Anti-shrinkage, high-elastic, and strong thermoplastic polyester elastomer foams fabricated by microcellular foaming with CO2 & N2 as blowing agents. J. CO2 Util. 2022, 62, 102076 10.1016/j.jcou.2022.102076. [DOI] [Google Scholar]
- McKinley G. H.; Hassager O. The Considere condition and rapid stretching of linear and branched polymer melts. J. Rheol. 1999, 43, 1195–1212. 10.1122/1.551034. [DOI] [Google Scholar]
- Yao M.; Spiegelberg S. H.; McKinley G. H. Dynamics of weakly strain-hardening fluids in filament stretching devices. J. Non-Newtonian Fluid Mech. 2000, 89, 1–43. 10.1016/S0377-0257(99)00028-2. [DOI] [Google Scholar]
- Xu Z.; Wang G.; Zhao J.; Zhang A.; Zhao G. Super-elastic and structure-tunable poly (ether-block-amide) foams achieved by microcellular foaming. J. CO2 Util. 2022, 55, 101807 10.1016/j.jcou.2021.101807. [DOI] [Google Scholar]
- Lee S.-T.; Park C. B.. Foam extrusion: principles and practice; CRC press, 2014. [Google Scholar]