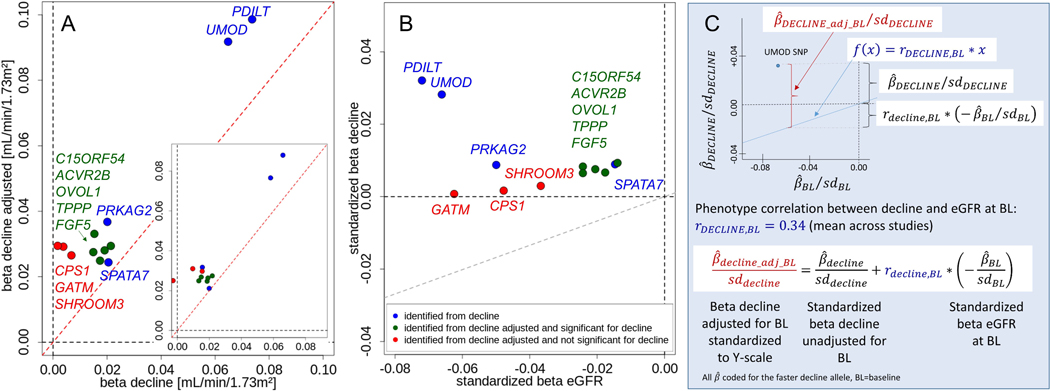
Figure 2: Relationship of SNP-effects on eGFR-decline baseline-unadjusted with baseline-adjusted effects for the 12 identified variants.
Shown are: (A) SNP-effects per year and allele for eGFR-decline baseline-unadjusted (“decline”) versus eGFR-decline baseline-adjusted in all studies (ndecline=343,339; ndecline-adj=320,737) and restricted to studies where baseline-adjusted results were computed rather than formula-derived (inserted panel, n=103,970); red line indicates identify line); (B) standardized SNP-effects per year and allele for eGFR-decline baseline-unadjusted (, n=343,339) and per allele for cross-sectional eGFR on ln-scale (, n=765,348 15); grey line indicates phenotype correlation line y=0.34*x (0.34=mean phenotype correlation across studies). For A&B: coding allele is the faster-decline allele (=cross-sectional eGFR-lowering allele). Color codes whether SNP was identified for decline baseline-unadjusted and/or baseline-adjusted. (C) Illustration of the SNP-effect for eGFR-decline baseline-adjusted (standardized to Y-scale) as a sum of the SNP-effect baseline-unadjusted (standardized) and the correlation-weighted SNP-effect on eGFR at baseline (standardized).

