
Figure 7.
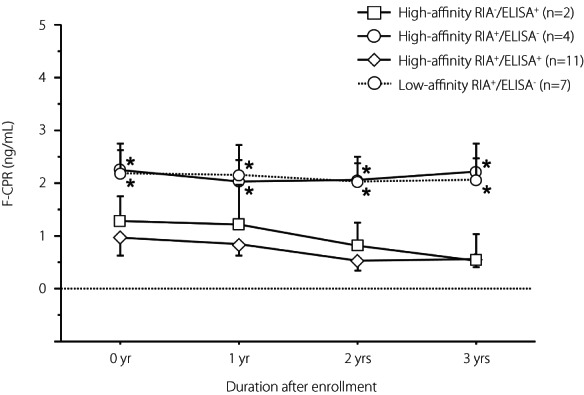
Comparison of serial change of fasting C‐peptide levels for 3 years in the four groups of patients with slowly progressive type 1 diabetes: High‐affinity ELISA‐GADA+ alone, High‐affinity RIA‐GADA+ alone, High‐affinity GADA+ in both RIA and ELISA, and Low‐affinity RIA‐GADA+ alone. Data are mean ± SE. Patients with low‐affinity ELISA‐GADA+ alone were not included, because C‐peptide data were unavailable. F‐CPR, fasting C‐peptide. *P < 0.05 vs High‐affinity RIA+/ELISA+ group.