
Figure 1.
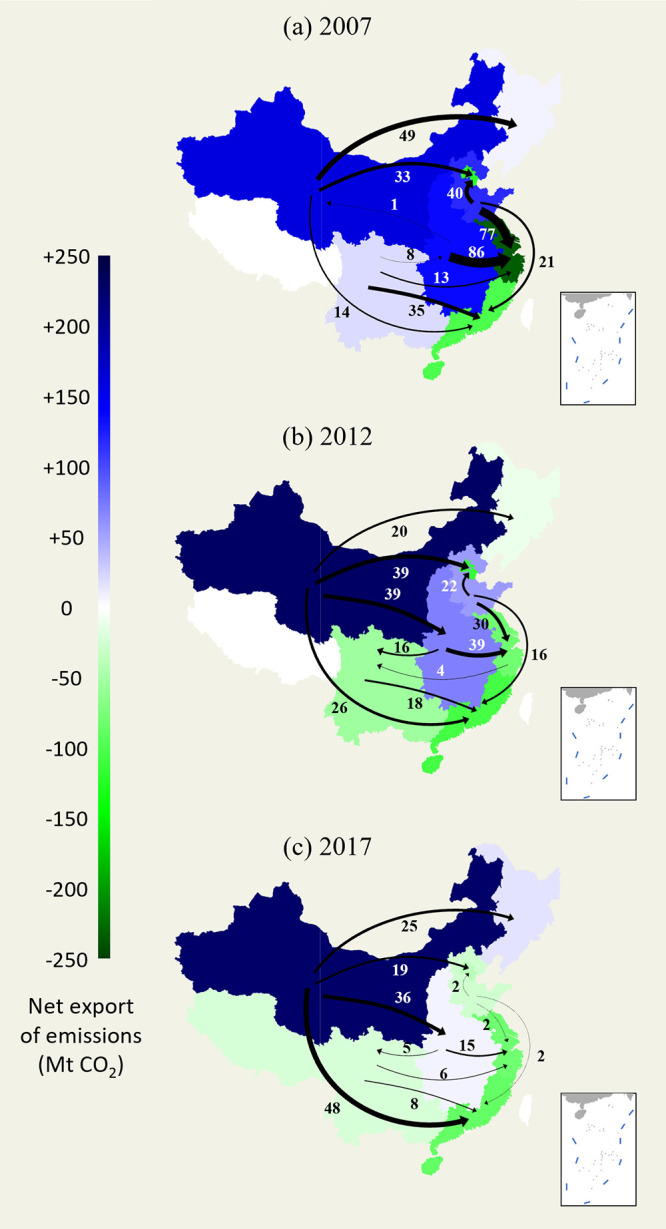
Net flow of CO2 emissions embodied in domestic trade among regions of China in (a) 2007, (b) 2012, and (c) 2017. Provinces colored in white indicate an absence of data. The 8 regions are divided in accordance with the widely practiced China administrative region specification (see Table S1 in Supporting Information). Note that not all transregional flows are presented in this figure due to artistic constraints. Please refer to the Table S2 in Supporting Information for the comprehensive data set used to produce this figure.