
Figure 4.
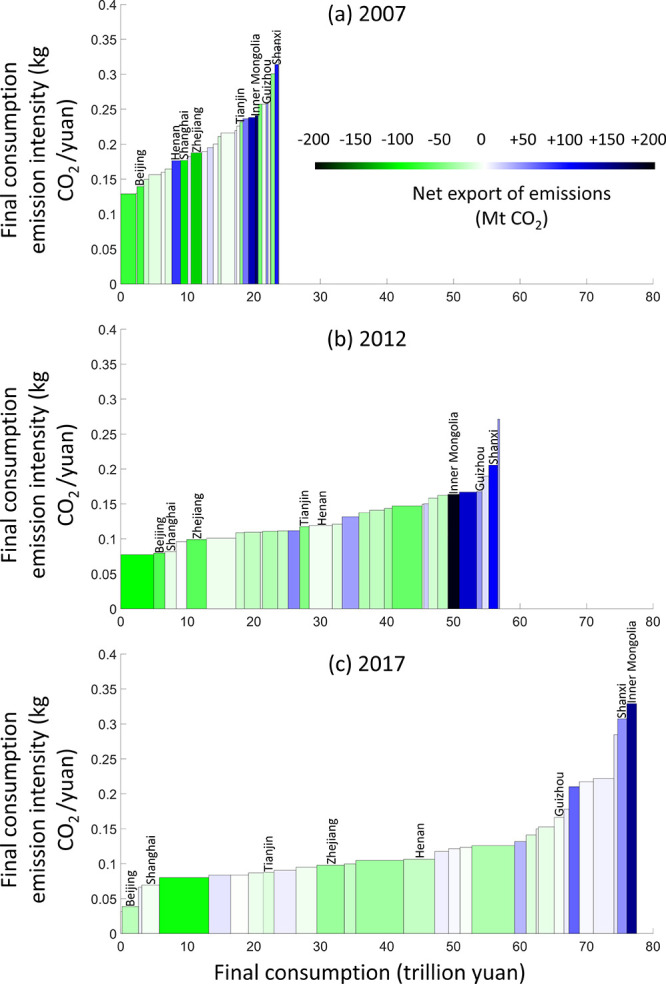
Final consumption, consumption-based CO2 emission intensities, and net exports of embodied CO2 emissions of China’s provinces in (a) 2007, (b) 2012, and (c) 2017. Each rectangular bar represents the size of the consumption-based emissions of the labeled province. The heights and widths of the bars show the final consumption emission intensities and final consumption of the labeled provinces, respectively. The face color of the bars indicates net trades of embodied CO2 emissions. Darker green means larger net imports of embodied CO2 emissions. Darker blue means larger net exports of embodied CO2 emissions. Please see Table S3 in Supporting Information for data result.