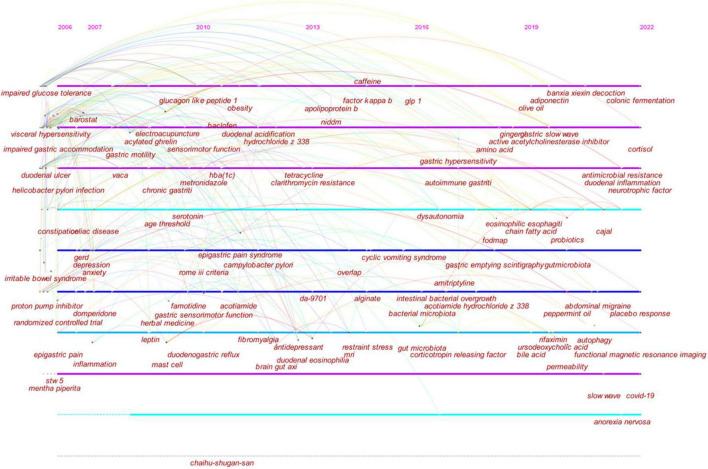
FIGURE 7.
Timeline visualization of co-occurring author keywords network. In the map, each author keyword is displayed along with the year in which it first appeared. Each node represents an author keyword. Co-occurrences of author keywords are represented by the links. The node’s size is proportional to the frequency with which an author keyword occurs.

