
Figure 2. Quantification of interaction between BlsA and binding partners.
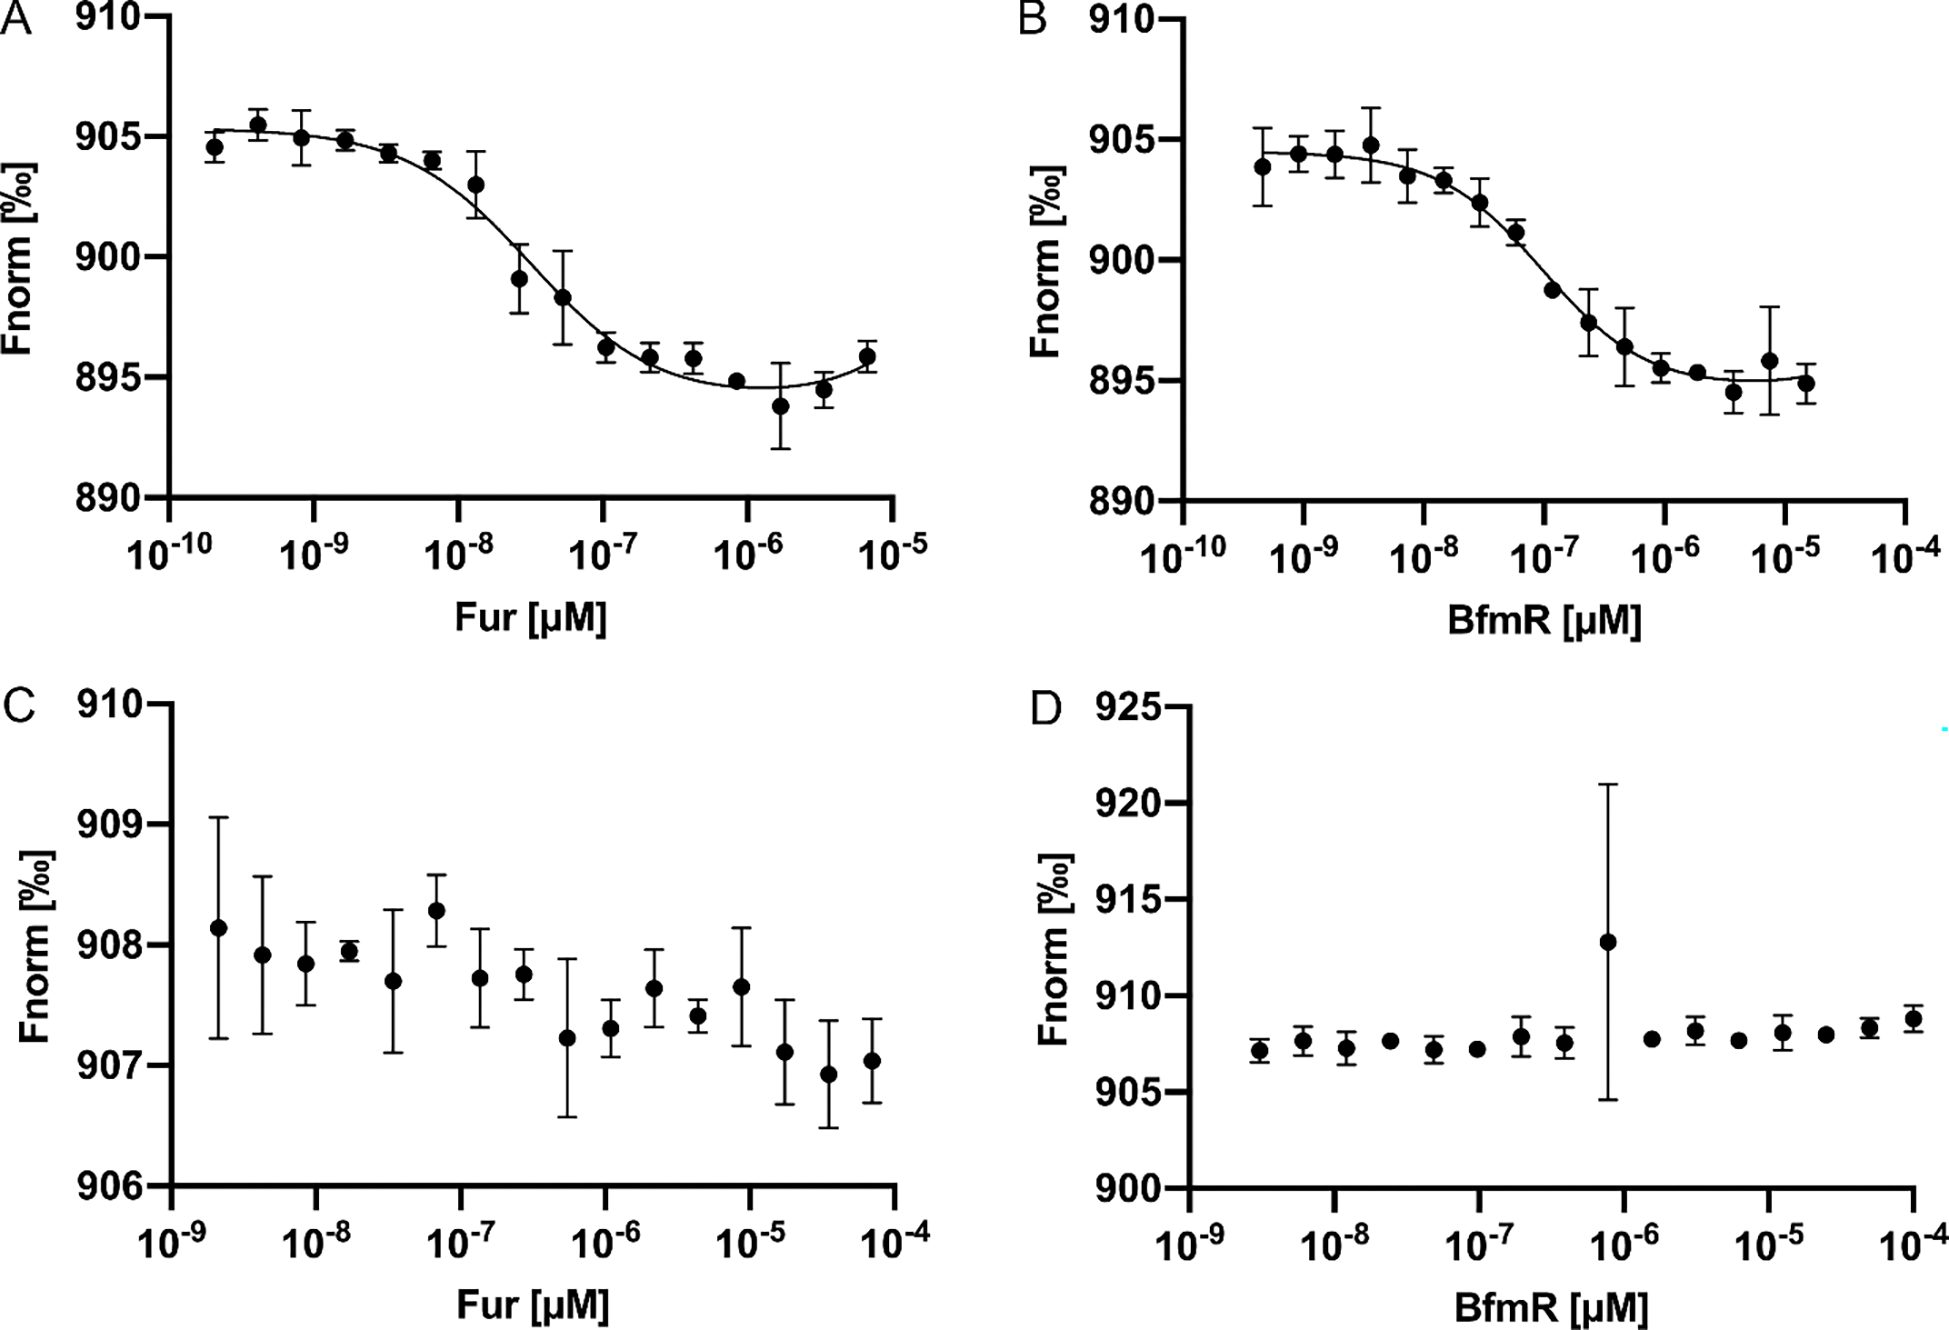
Microscale thermophoresis (MST) was used to quantify the binding affinity of BlsA and potential binding partners. TRX-BlsA and Fur (A) interact with a KD of 10 nM, while TRX-BlsA and BfmR (B) have a KD of 3 nm. No measurable interactions were observed for the control reactions, TRX with Fur (C) or TRX with BfmR (D). Additional controls are shown in Figure S3. All MST measurements were conducted in triplicate, in ambient light at 23 °C. Error bars correspond to standard deviation of the triplicate measurements.