
Figure 4. Absorbance spectra and size-exclusion chromatography results.
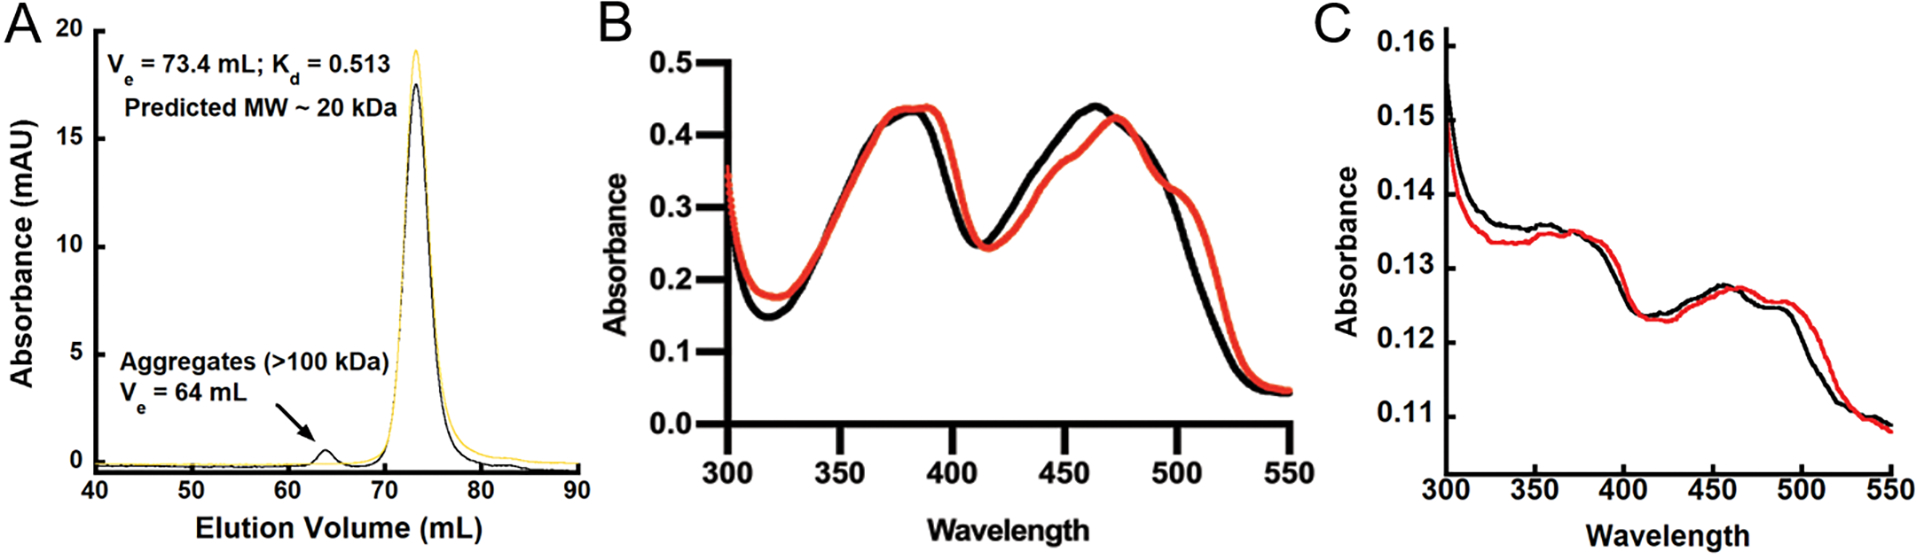
Size exclusion chromatography was carried out to characterize the oligomeric state of BlsA (A). The protein eluted as a monomer both when the SEC was carried out in the dark (grey line) or when illuminated with blue light (yellow line). The standards used and standard curve for the analysis is given in Figure S4. A comparison of the absorbance spectrum of hexahistidine-tagged BlsA in the dark state (B, black) to the spectrum collected after the protein was illuminated with blue light (B, red) shows the red shift that is characteristic of BLUF proteins. Similarly, the characteristic red shift is also seen in the absorbance spectra taken using BlsA crystals (C).