FIG. 3.

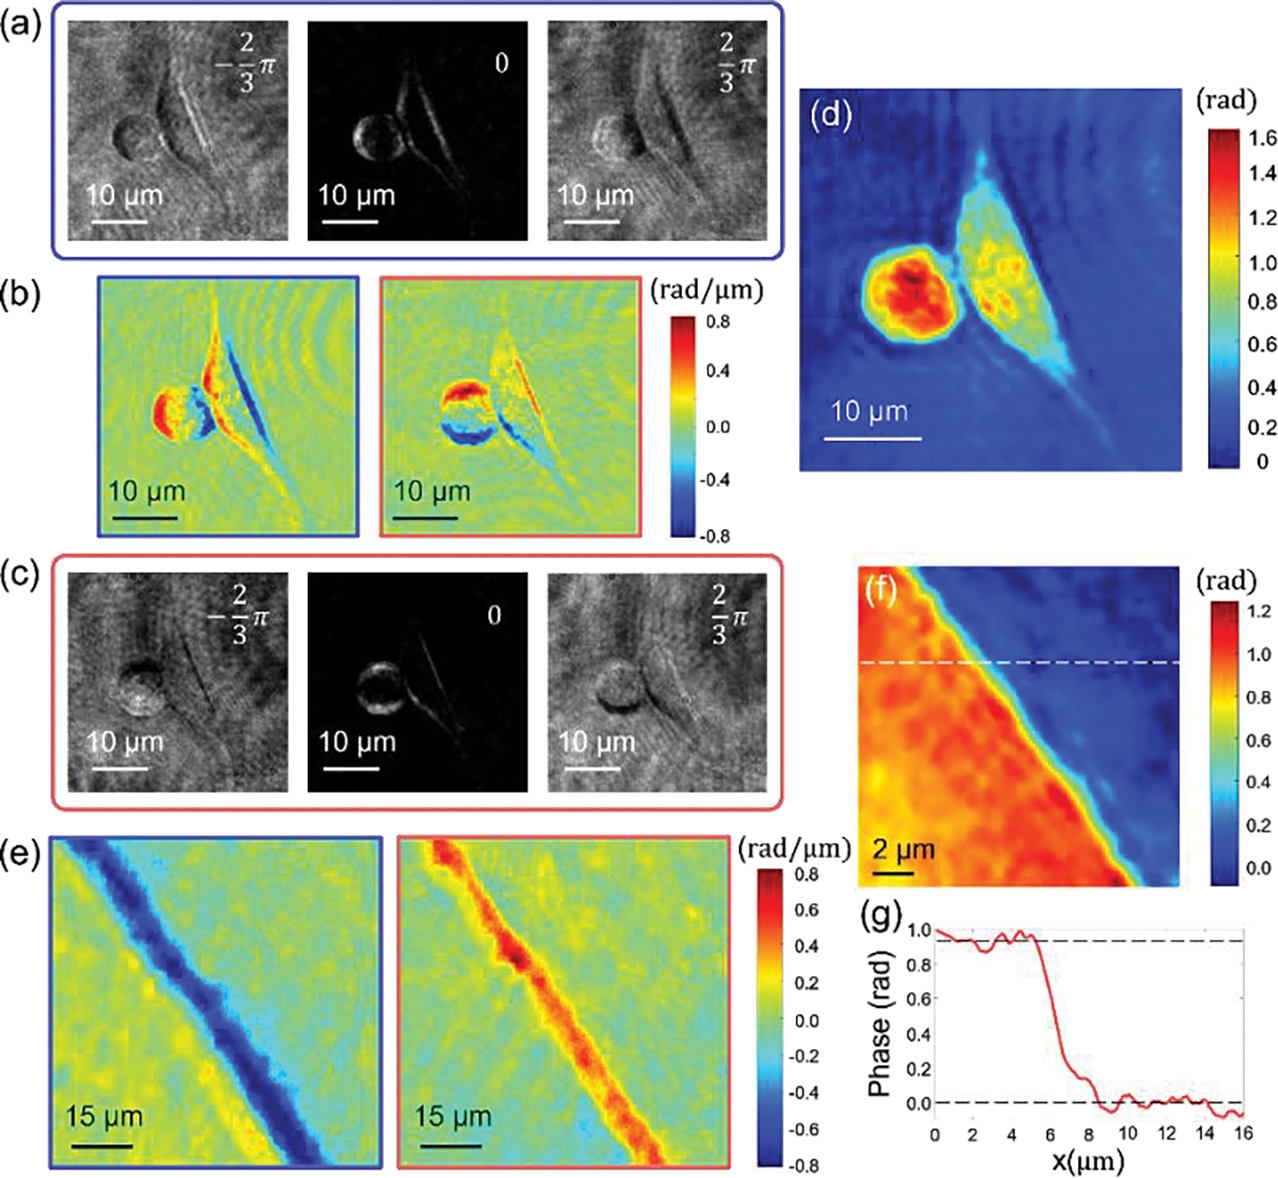
Quantitative phase imaging of NIH3T3 cells with a laterally displaced metasurface. (a) and (c) retardance images with bias retardation of −120°, 0°, 120° for vertical and horizontally orientated metasurface. Scale bar, 10 μm. (b) The phase gradient images with respect to x and y axis calculated with the three images for horizontal and vertical directions. (d) The retrieved quantitative phase image of NIH3T3 cells. (e) The phase gradient images of the calibration sample. The left region corresponds to a PMMA thin film with 160-nm-thickness. (f) The retrieved quantitative phase image of the PMMA calibration sample. (g) Cross-section along the dashed line in (f). The phase difference of the two regions matches with the expected thickness of the thin film.
