
Figure 1.
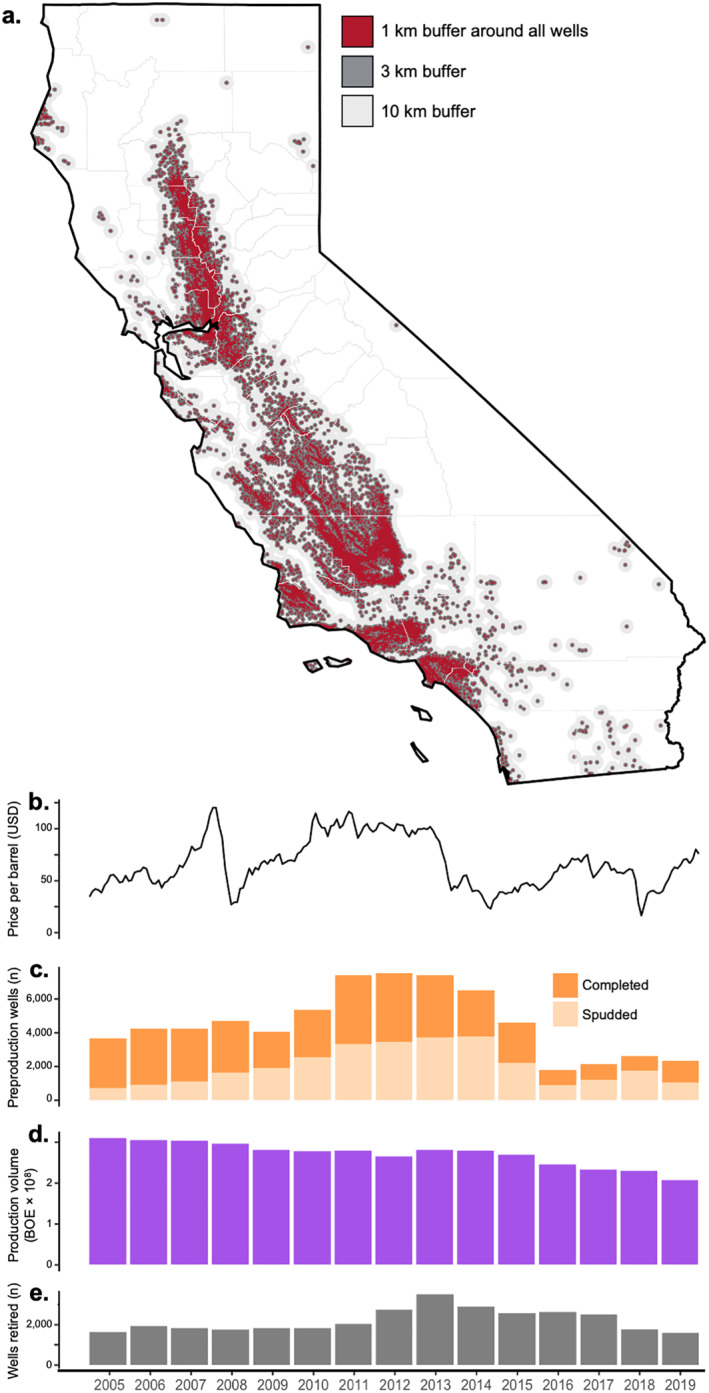
(a) Map of California showing 1, 3, and 10 km buffers around all wells in the preproduction, production, and postproduction stages during the study period, 2005–2019. (b) Midway‐Sunset first purchase price of a barrel of oil in U.S. dollars by month, an indicator for California oil prices. (c) Annual count of wells in preproduction in California, including wells spudded or completed. (d) Sum of annual oil and gas production volume in hundreds of millions of barrels of oil equivalent at all active wells. (e) Wells entering the postproduction stage (i.e., retired) by year, including plugged and long‐term idle wells (≥8 years without production).