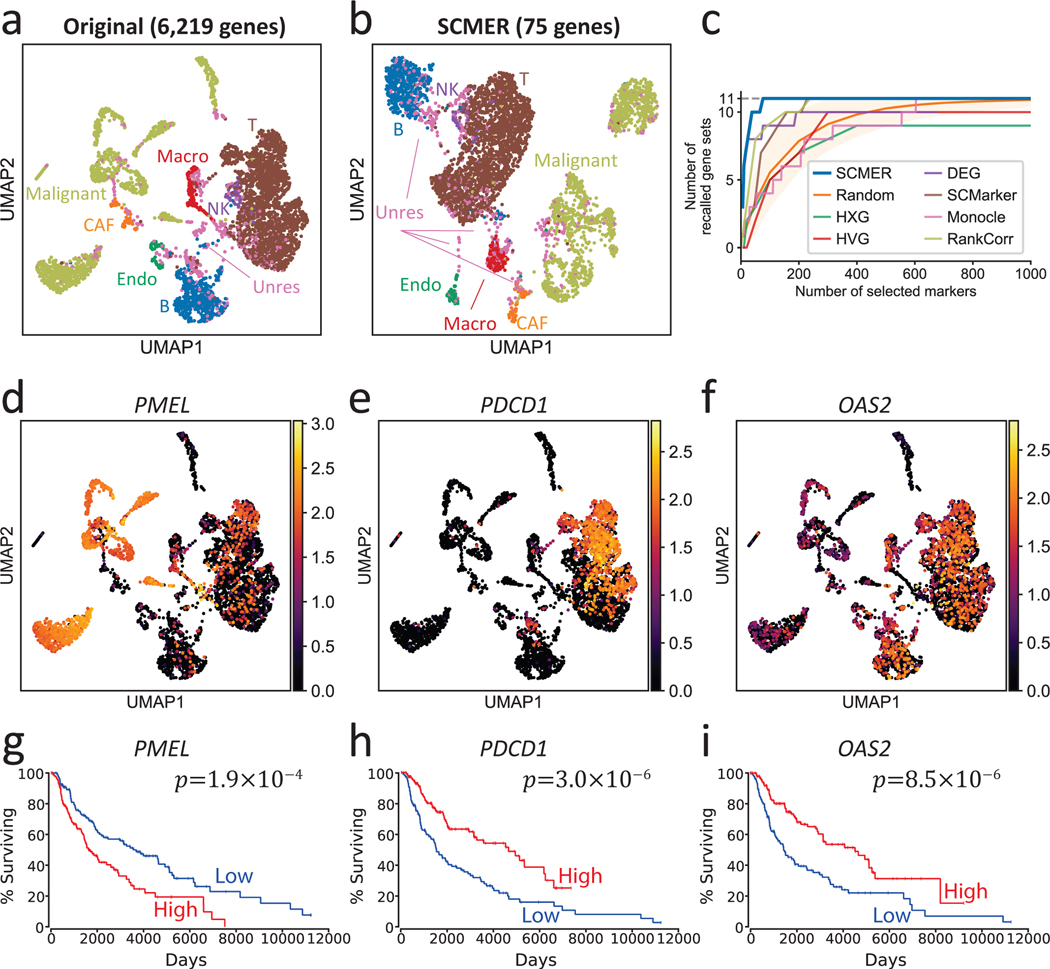
Fig. 2: Results of the data of melanoma patients.
(a) UMAP embedding of the dataset without feature selection. Each dot represents a cell and the cell types are color-coded (Macro: macrophages, Endo: endothelial cells, CAF: cancer-associated fibroblasts, Unres: unresolved cells; labels and dots are colored synchronously by cell types).
(b) UMAP of the dataset using SCMER selected genes.
(c) Recall of gene sets for SCMER, SCMarker, Monocle 2, RankCorr, highly expressed genes (HXG), highly variable genes (HVG), principal component analysis (PCA), and differentially expressed genes (DEG, supervised). X-axis is the number of selected genes and Y-axis is the number of covered gene sets. A gene set is considered recalled when at least one gene in the set is selected. “Random” shows the expected number of gene sets for randomly selected markers. The area corresponds to 1.645 x standard deviation on each side. Results above the area has p < 0.05 based on one-sided z-test.
(d-f) RNA expression levels of genes showing intra-cluster gradients. Cells are in the same locations as in
(a) and overlaid with RNA expression levels (color bar).
(g-i) Overall Kaplan-Meier survival curve for selected markers in TCGA SKCM. High and low include patients in above and under 33% percentile, respectively. Each group includes n = 151 patients.

