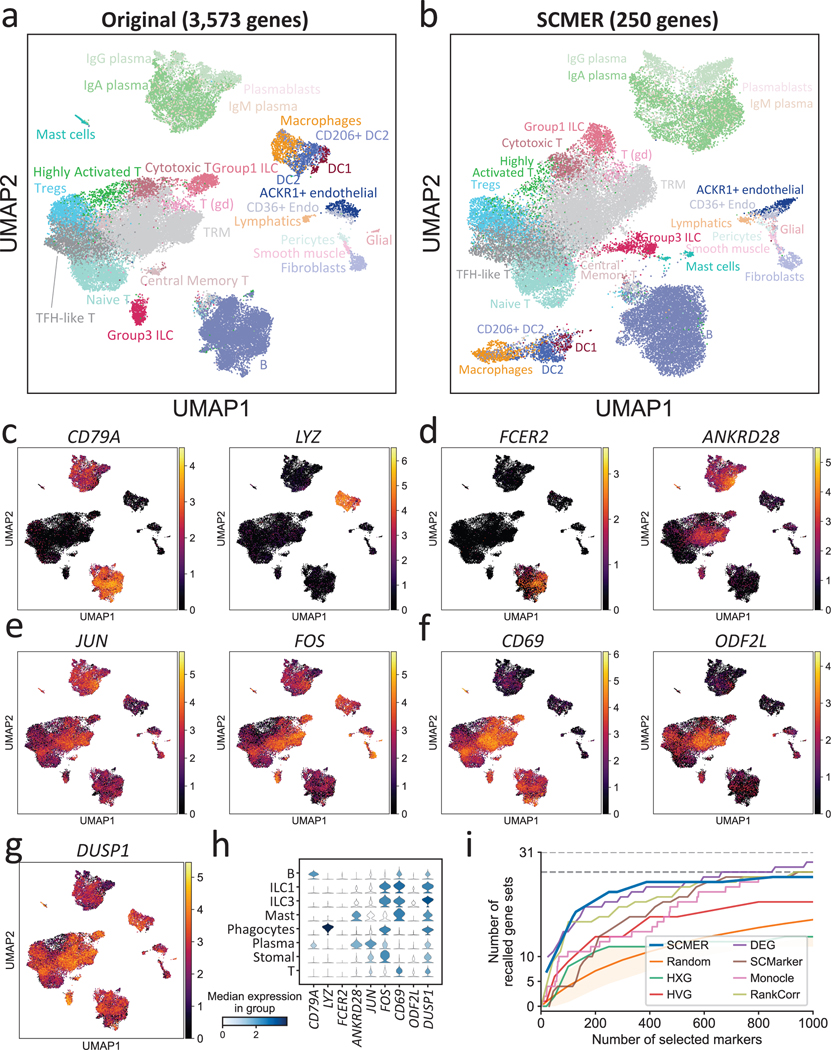
Fig. 3: Results of the ileum lamina propria immunocytes data.
(a) UMAP embedding of the original dataset. Each dot represents a cell and the cell types are color coded (T (gd): gamma-delta T cell, Tregs: regulatory T cell, Endo: endothelial cell, TRM: tissue-resident memory T cell, DC: dendritic cell, ILC: innate lymphoid cell).
(b) UMAP embedding of the same dataset based on genes selected by SCMER.
(c-f) Examples of RNA expression levels of the genes selected by SCMER that (c) distinguish major cell types and (d) subtypes, (e) are transcription factors regulating different cell types, and (f) show gradual changes among cell states. Cells are in the same locations as in (a) and overlaid with RNA expression levels (color bar).
(g) The RNA expression level of DUSP1. See Supplementary Figure 7 for DUSP2 and DUSP4.
(h) Distributions of the RNA expression levels in major cell types of the genes above.
(i) Recalls of the gene sets selected by SCMER, SCMarker, Monocle 2, HXG, HVG, PCA, and DEG, similar to Fig. 2c.

