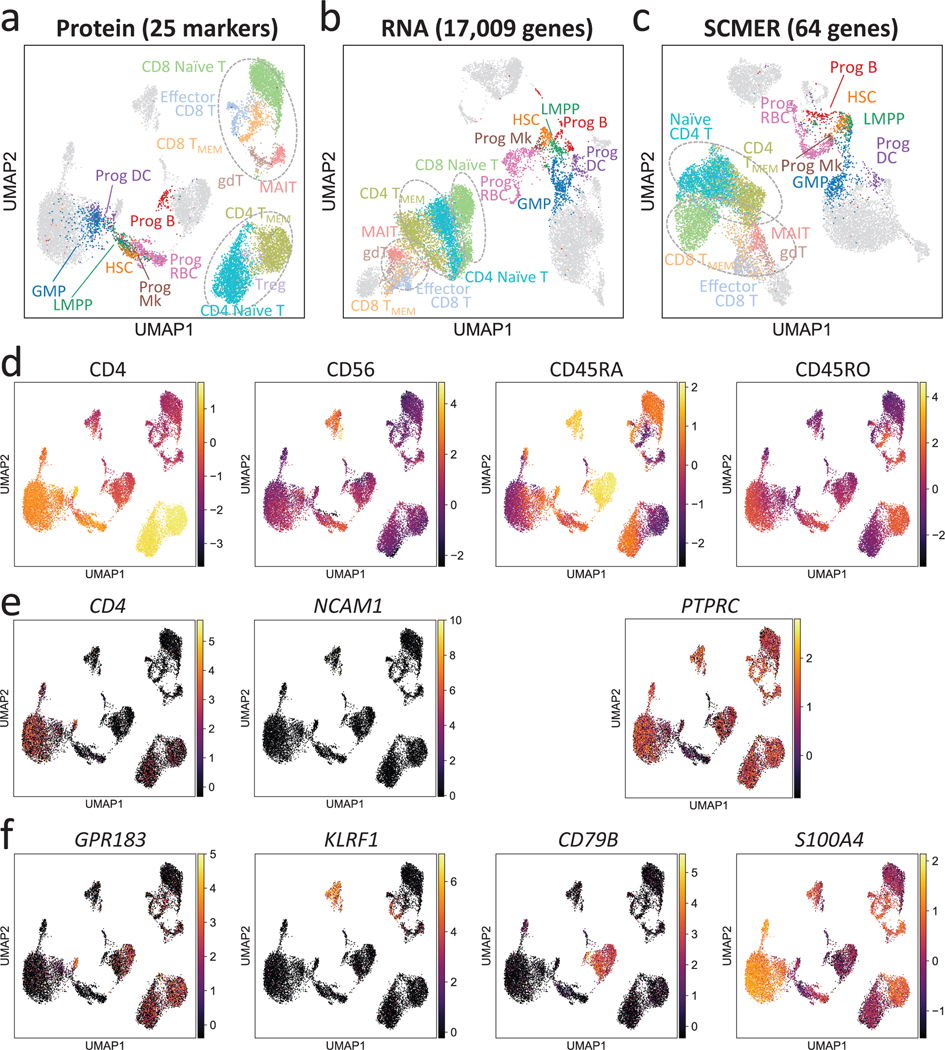
Fig. 5: Results of the CITE-seq bone marrow mononuclear cells data.
(a-c) UMAP embedding of the original dataset using (a) protein, (b) all genes, and (c) SCMER selected genes. CD4-like T cells (CD4 TMEM and CD4 Naïve T), CD8-like T cells [Effector CD8 T, CD4 TMEM, CD8 Naïve T, gamma-delta T (gdT) cells, and Mucosal-associated invariant T (MAIT) cells] are framed by dotted circles, respectively, for better visual identification. Three circles are present in the result of RNA because of two separate clusters for CD8-like T cells. Also highlighted are progenitor cells [hematopoietic stem cells (HSCs), lymphoid-primed multipotent progenitors (LMPPs), granulocyte-monocyte progenitor cells (GMPs), and Progenitor (Prog) of B cells, megakaryocytes (Mks), red blood cells (RBCs), and dendritic cell (DCs)]. Fully annotated cell types are shown in Supplementary Figure 10.
(d-f) Levels of (d) proteins, (e) genes encoding the proteins, and (f) genes selected by SCMER. Cells are in the same locations as in (a) and overlaid with RNA expression level (color bar).

