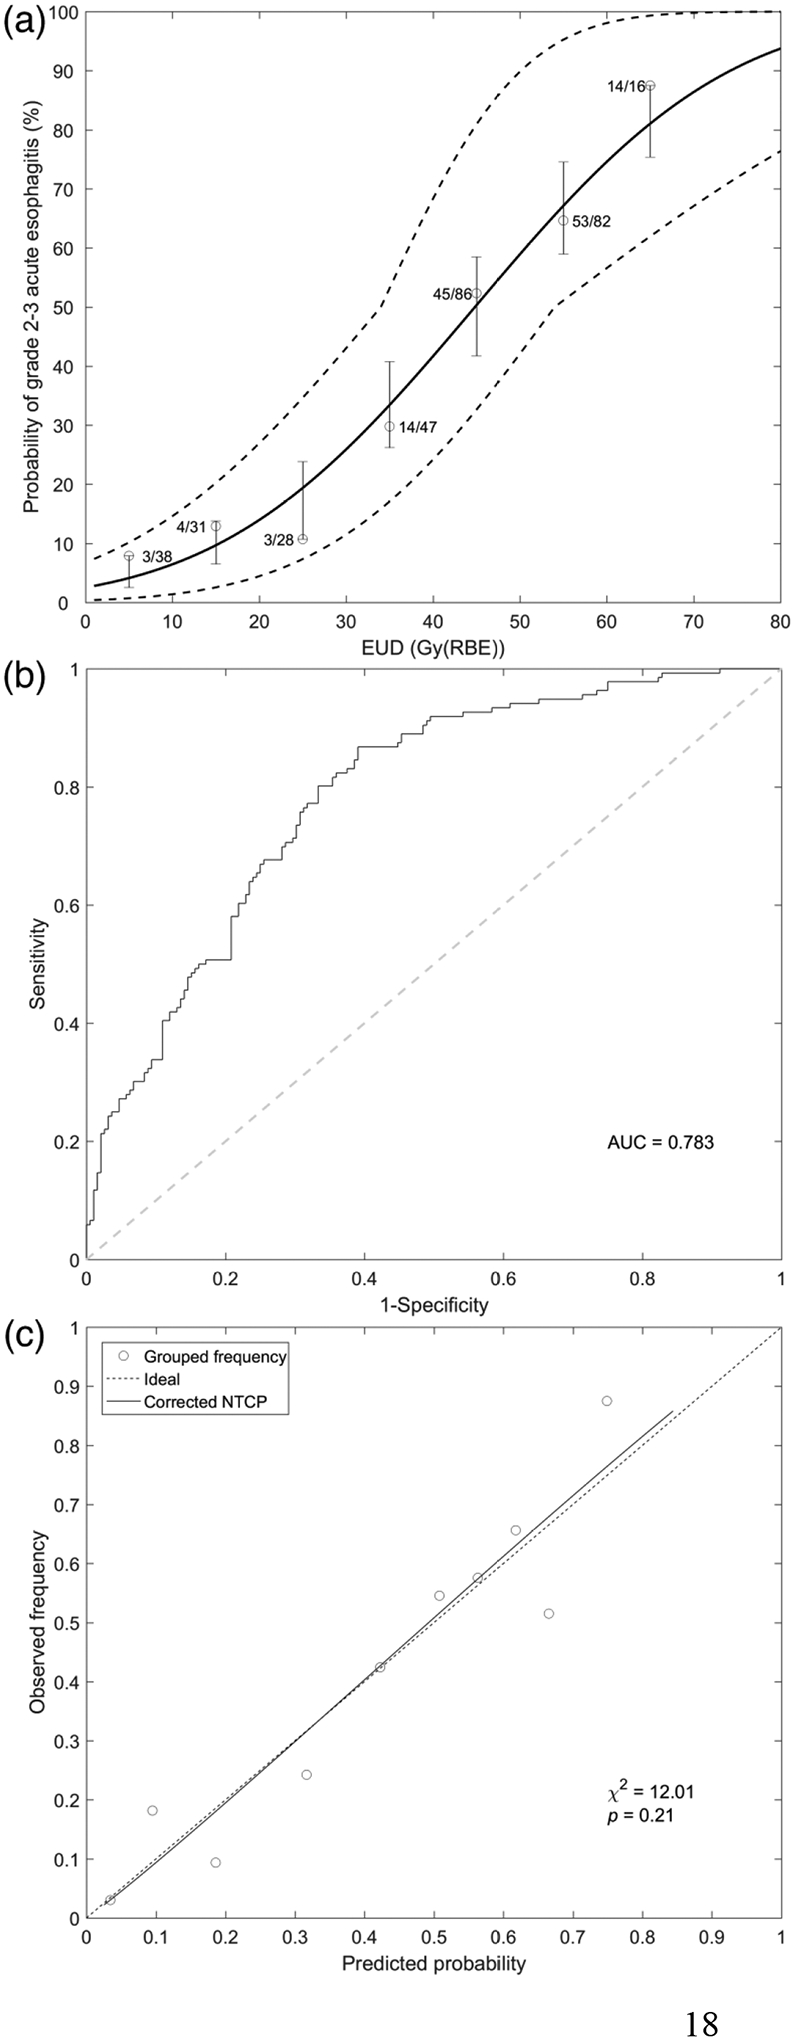
Figure 1.

Lyman-Kutcher-Burman modeling results for predicting grade 2 or higher radiation-induced esophagitis (RE) in non–small cell lung cancer patients receiving proton radiotherapy. (a) Normal tissue complication probability (NTCP) curve versus equivalent uniform dose (EUD). Solid curve represents LKB NTCP model with optimal parameters: n = 0.24, m = 0.51, and TD50 = 44.83 Gy (RBE). The dashed curves indicate the 95% confidence region of the NTCP model. Dose range was divided into eight equal parts with a EUD bin of 10 Gy (RBE). For each bin, the circle represents the actual incidence of grade 2 or higher RE. The lower and upper bounds of the bar are minimum and maximum values of the predicted NTCP within each bin. (b) Receiver operating characteristic curve. (c) Calibration plot with Hosmer-Lemeshow test results.
