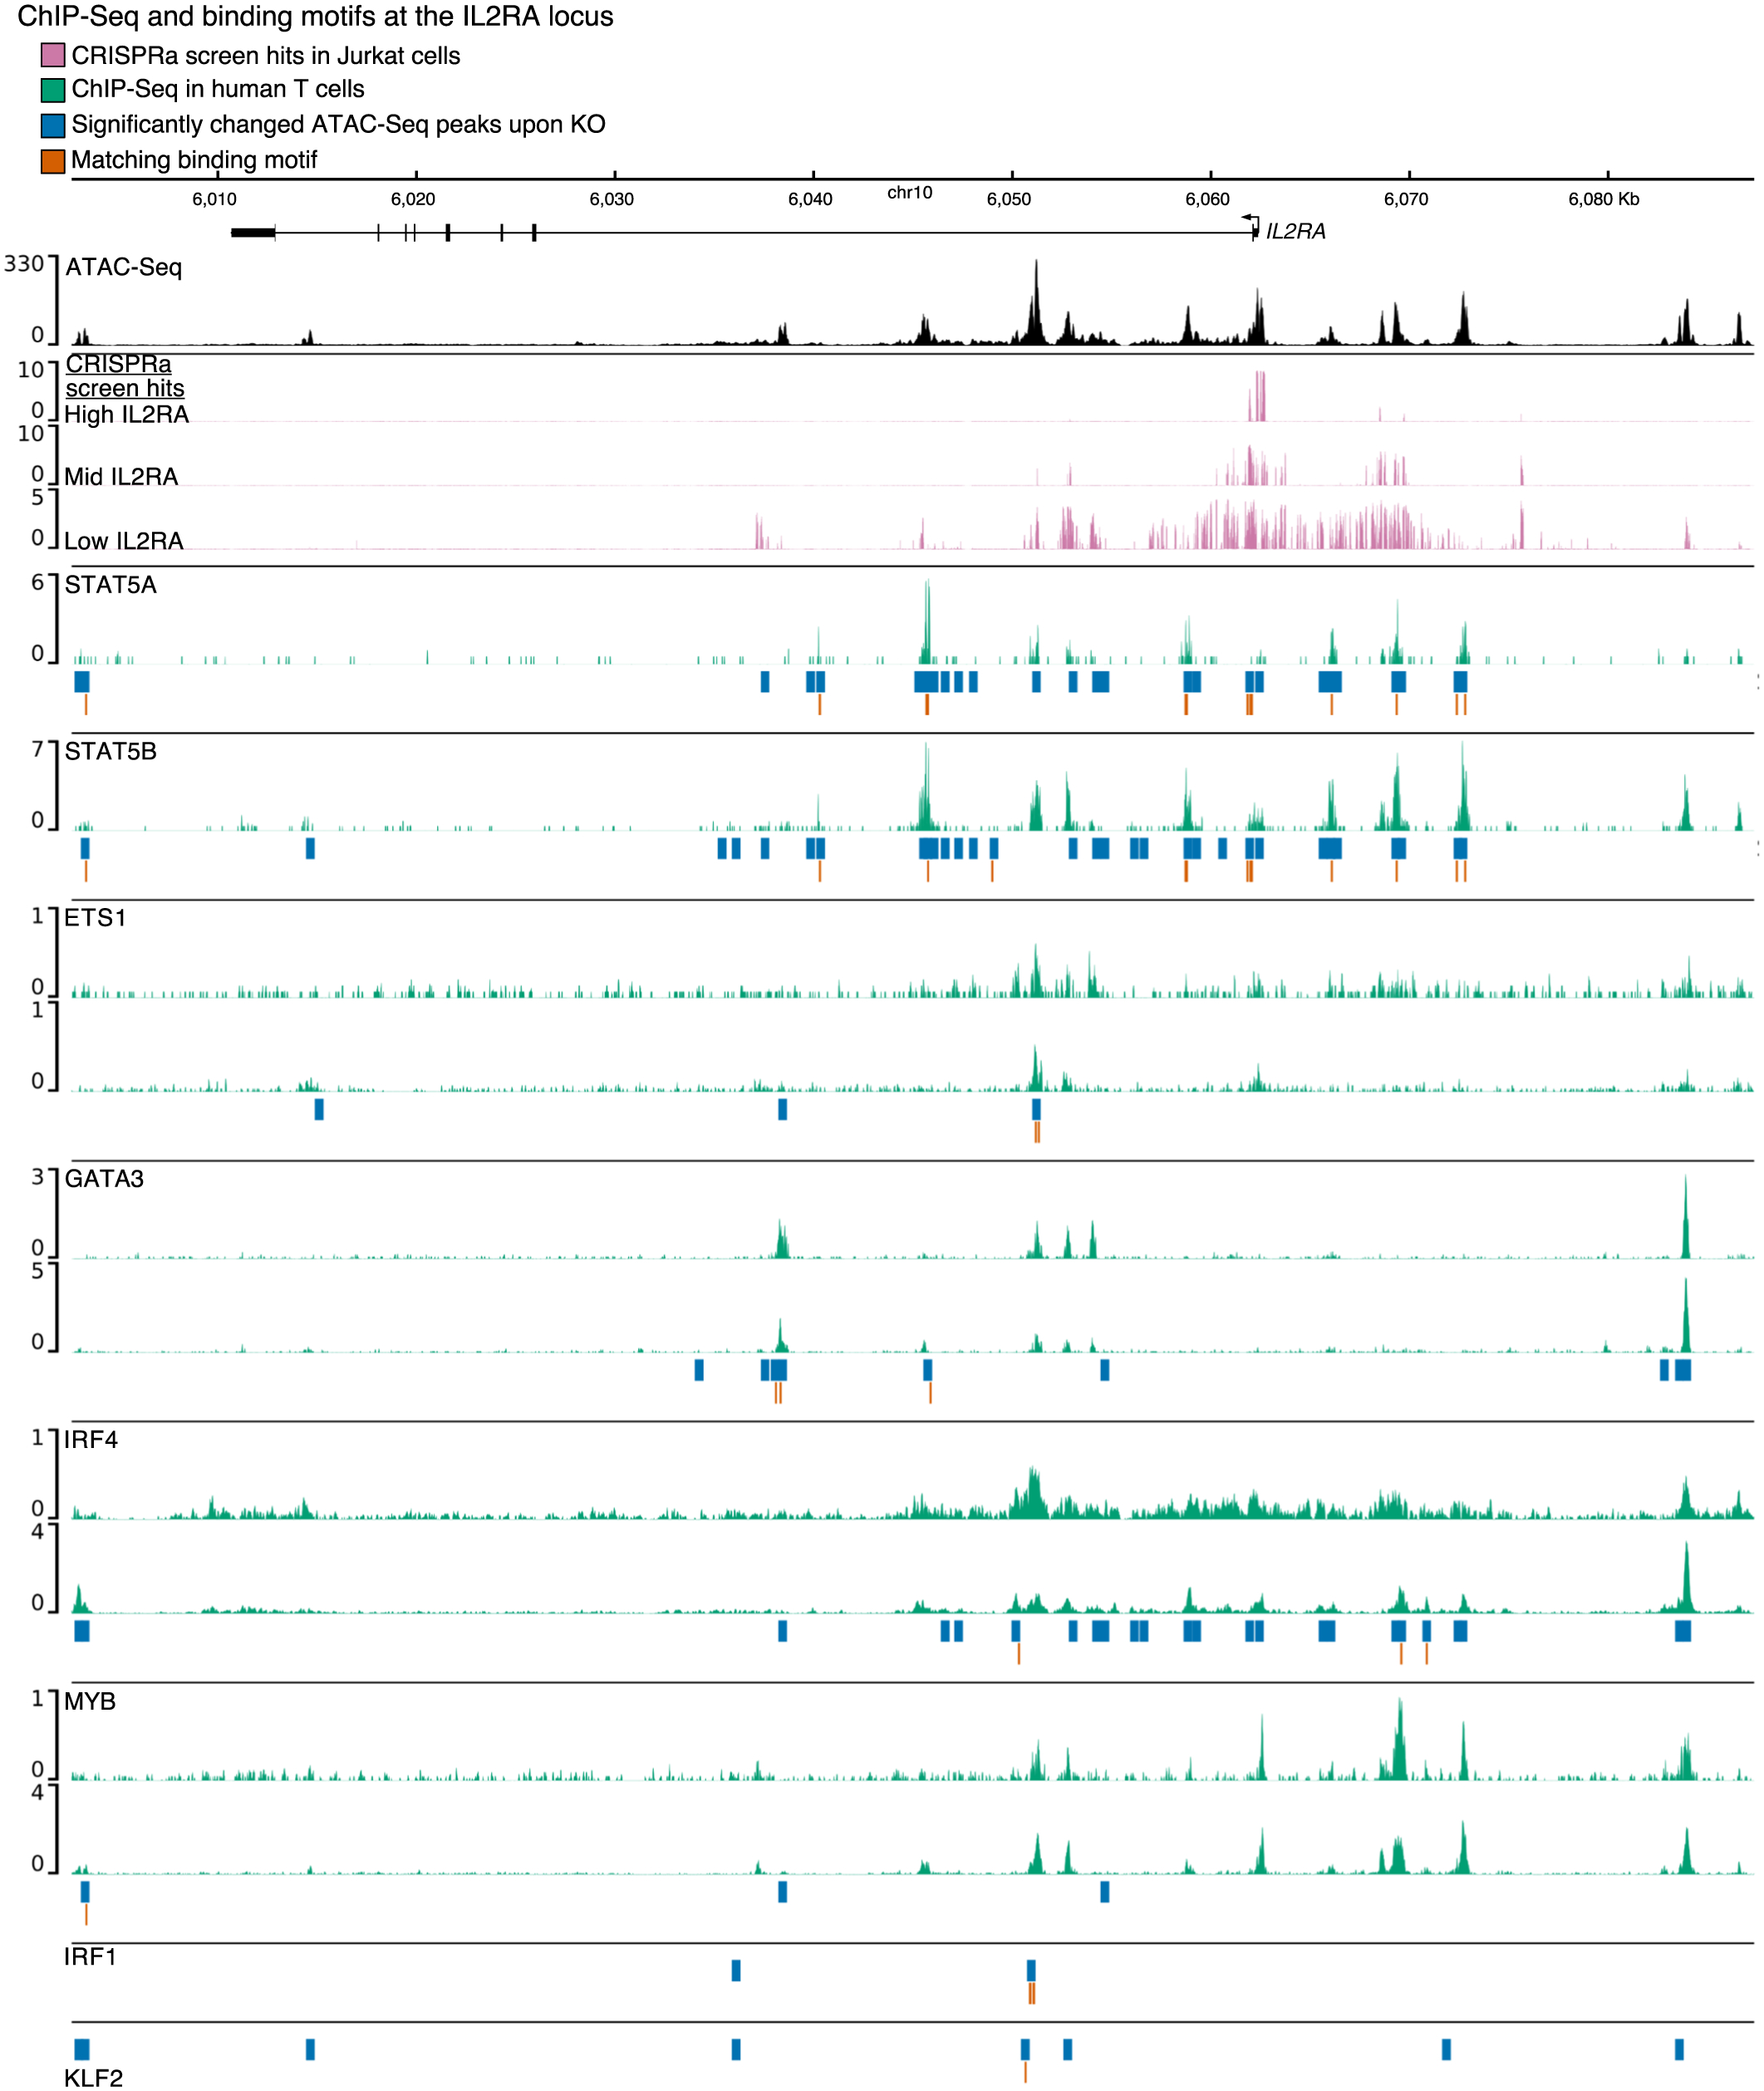
Extended Data Fig. 4 |. Direct binding of IL2RA regulators at the IL2RA locus.

Chromatin accessibility measured by ATAC-Seq in AAVS1 control knockouts is shown in black. ATAC-Seq data are shown as normalized read coverage; samples were normalized using the size factors from DESeq2. Results from previous CRISPR activation (CRISPRa) screen38 tiling the IL2RA locus in Jurkat cells is shown in pink. CRISPRa tracks show the log2 enrichment of guide RNAs in cells expressing high, mid, or low levels of IL2RA compared to background. Public ChIP-Seq data for IL2RA regulators in various subsets of human CD4 + T cells (STAT5A, STAT5B, ETS1, GATA3, MYB) or engineered bulk T cells (IRF4) are shown in green. ChIP-Seq data are shown as background subtracted binding in reads per million. ATAC-Seq peaks that were significantly differentially accessible in each knockout are shown in blue. The location of a matching binding motif in a significantly differentially accessible peak for each transcription factor is shown in orange. Where available, public ChIP-Seq tracks are from either two independent studies or individual donors: ETS148,81, GATA347, IRF482, MYB83, STAT5A and STAT5B84. chr, chromosome.
