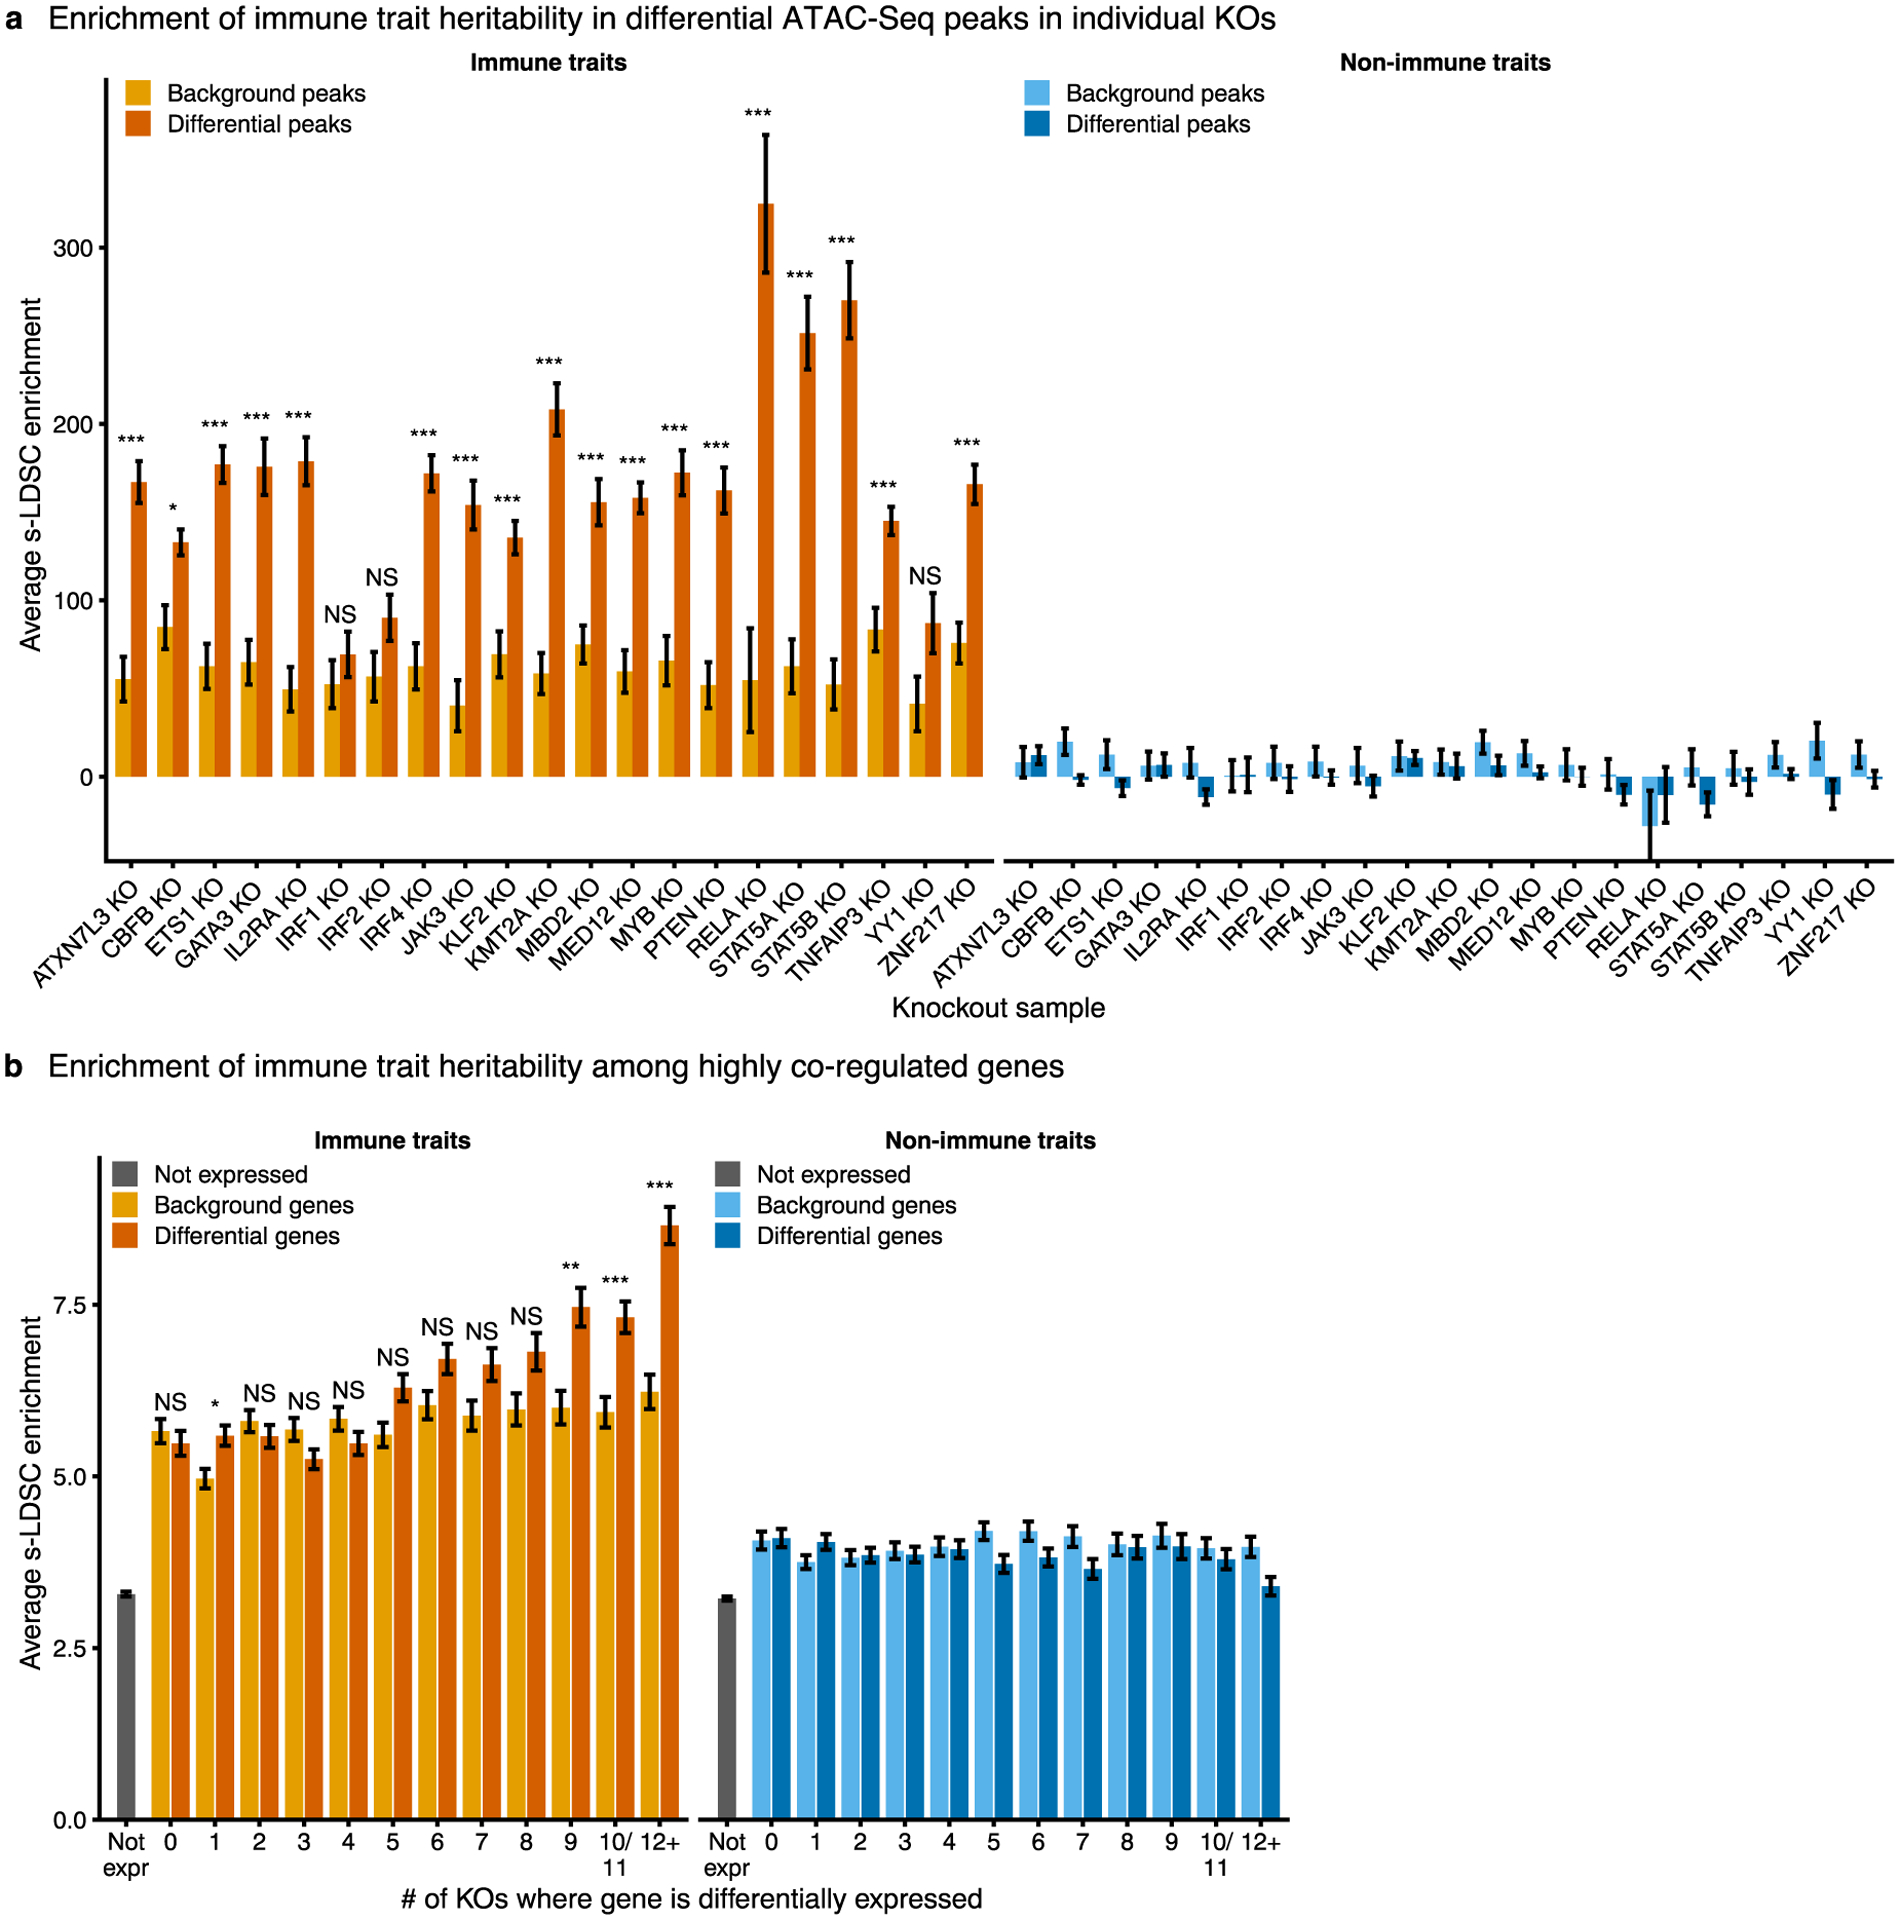
Extended Data Fig. 5 |. Highly co-regulated gene sets are enriched for immune disease genes.

a, Enrichment of heritability for immune traits compared to non-immune traits in significantly differentially accessible ATAC-Seq peaks for each knockout. Only knockouts with at least 1,000 significantly differentially accessible ATAC-Seq peaks are shown. b, Enrichment of heritability for immune traits compared to non-immune traits in a 100-kb window around co-regulated genes. Enrichment for matched background sets for each knockout (a) or each co-regulation bin (b) are shown. Enrichment calculated using stratified LD score regression. Traits were meta-analyzed using inverse-variance weighting; average enrichment and standard error shown. P-values were calculated by first converting the difference in average enrichments to Z-scores, and then converting Z-scores to two-sided P-values (see Methods). For a, Bonferroni-corrected P-values range from 1.8 × 10⁻² to 7.5 × 10⁻¹⁶. For b, Bonferroni corrected P-values range from 2.7 × 10⁻² to 6.6 × 10⁻¹⁰. NS, not significant. n = 16 immune traits and n = 15 non-immune traits for a and b.
